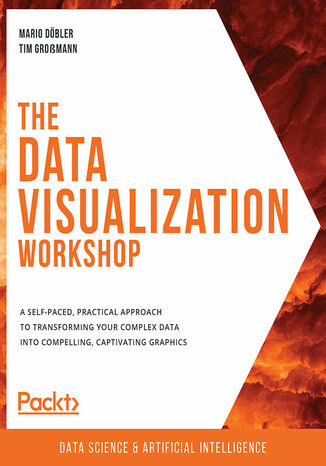
The Data Visualization Workshop. A self-paced, practical approach to transforming your complex data into compelling, captivating graphics Mario Döbler, Tim Großmann


- Autorzy:
- Mario Döbler, Tim Großmann
- Wydawnictwo:
- Packt Publishing
- Ocena:
- Stron:
- 536
- Dostępne formaty:
-
PDFePubMobi
Opis
książki
:
The Data Visualization Workshop. A self-paced, practical approach to transforming your complex data into compelling, captivating graphics
The Data Visualization Workshop will guide you through the world of data visualization and help you to unlock simple secrets for transforming data into meaningful visuals with the help of exciting exercises and activities.
Starting with an introduction to data visualization, this book shows you how to first prepare raw data for visualization using NumPy and pandas operations. As you progress, you’ll use plotting techniques, such as comparison and distribution, to identify relationships and similarities between datasets. You’ll then work through practical exercises to simplify the process of creating visualizations using Python plotting libraries such as Matplotlib and Seaborn. If you’ve ever wondered how popular companies like Uber and Airbnb use geoplotlib for geographical visualizations, this book has got you covered, helping you analyze and understand the process effectively. Finally, you’ll use the Bokeh library to create dynamic visualizations that can be integrated into any web page.
By the end of this workshop, you’ll have learned how to present engaging mission-critical insights by creating impactful visualizations with real-world data.
Wybrane bestsellery
Packt Publishing - inne książki
Dzięki opcji "Druk na żądanie" do sprzedaży wracają tytuły Grupy Helion, które cieszyły sie dużym zainteresowaniem, a których nakład został wyprzedany.
Dla naszych Czytelników wydrukowaliśmy dodatkową pulę egzemplarzy w technice druku cyfrowego.
Co powinieneś wiedzieć o usłudze "Druk na żądanie":
- usługa obejmuje tylko widoczną poniżej listę tytułów, którą na bieżąco aktualizujemy;
- cena książki może być wyższa od początkowej ceny detalicznej, co jest spowodowane kosztami druku cyfrowego (wyższymi niż koszty tradycyjnego druku offsetowego). Obowiązująca cena jest zawsze podawana na stronie WWW książki;
- zawartość książki wraz z dodatkami (płyta CD, DVD) odpowiada jej pierwotnemu wydaniu i jest w pełni komplementarna;
- usługa nie obejmuje książek w kolorze.
Masz pytanie o konkretny tytuł? Napisz do nas: sklep@helion.pl
Książka drukowana









Oceny i opinie klientów: The Data Visualization Workshop. A self-paced, practical approach to transforming your complex data into compelling, captivating graphics Mario Döbler, Tim Großmann
(0)