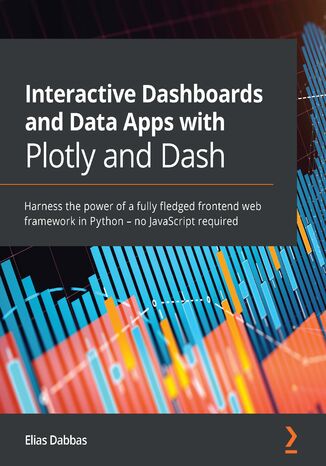
Interactive Dashboards and Data Apps with Plotly and Dash. Harness the power of a fully fledged frontend web framework in Python – no JavaScript required Elias Dabbas


- Autor:
- Elias Dabbas
- Serie wydawnicze:
- Learning
- Wydawnictwo:
- Packt Publishing
- Ocena:
- Stron:
- 364
- Dostępne formaty:
-
PDFePubMobi
Opis
książki
:
Interactive Dashboards and Data Apps with Plotly and Dash. Harness the power of a fully fledged frontend web framework in Python – no JavaScript required
Interactive Dashboards and Data Apps with Plotly and Dash will first give you an overview of the Dash ecosystem, its main packages, and the third-party packages crucial for structuring and building different parts of your apps. You'll learn how to create a basic Dash app and add different features to it.
Next, you’ll integrate controls such as dropdowns, checkboxes, sliders, date pickers, and more in the app and then link them to charts and other outputs. Depending on the data you are visualizing, you'll also add several types of charts, including scatter plots, line plots, bar charts, histograms, and maps, as well as explore the options available for customizing them.
By the end of this book, you'll have developed the skills you need to create and deploy an interactive dashboard, handle complexities and code refactoring, and understand the process of improving your application.
Wybrane bestsellery
Zobacz pozostałe książki z serii Learning
Packt Publishing - inne książki
Dzięki opcji "Druk na żądanie" do sprzedaży wracają tytuły Grupy Helion, które cieszyły sie dużym zainteresowaniem, a których nakład został wyprzedany.
Dla naszych Czytelników wydrukowaliśmy dodatkową pulę egzemplarzy w technice druku cyfrowego.
Co powinieneś wiedzieć o usłudze "Druk na żądanie":
- usługa obejmuje tylko widoczną poniżej listę tytułów, którą na bieżąco aktualizujemy;
- cena książki może być wyższa od początkowej ceny detalicznej, co jest spowodowane kosztami druku cyfrowego (wyższymi niż koszty tradycyjnego druku offsetowego). Obowiązująca cena jest zawsze podawana na stronie WWW książki;
- zawartość książki wraz z dodatkami (płyta CD, DVD) odpowiada jej pierwotnemu wydaniu i jest w pełni komplementarna;
- usługa nie obejmuje książek w kolorze.
Masz pytanie o konkretny tytuł? Napisz do nas: sklep@helion.pl
Książka drukowana



























Oceny i opinie klientów: Interactive Dashboards and Data Apps with Plotly and Dash. Harness the power of a fully fledged frontend web framework in Python – no JavaScript required Elias Dabbas
(0)