
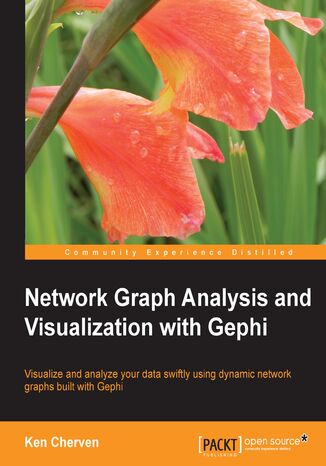
Network Graph Analysis and Visualization with Gephi. Gephi is a great platform for analyzing and turning your data into highly communicative visualizations, and this book will teach you to create your own network graphs, and then customize and publish them to the web Ken Cherven, Kenneth Michael Cherven


- Autorzy:
- Ken Cherven, Kenneth Michael Cherven
- Wydawnictwo:
- Packt Publishing
- Ocena:
- Stron:
- 116
- Dostępne formaty:
-
PDFePubMobi
 opcje wysyłki »
Opis
książki
:
Network Graph Analysis and Visualization with Gephi. Gephi is a great platform for analyzing and turning your data into highly communicative visualizations, and this book will teach you to create your own network graphs, and then customize and publish them to the web
Network Graph Analysis and Visualization with Gephi is a practical, hands-on guide that provides you with all the tools you need to begin creating your own network graphs. You will learn how to import data, test multiple graph layouts, and publish your visualizations to the Web.
Network Graph Analysis and Visualization with Gephi will teach you how to create your own network graphs using Gephi. The book begins by taking you through the installation of Gephi and configuring the installation options. You will also get acquainted with the Gephi workspace and the various tools in Gephi. Next, you'll use these tools to create your own graphs. If you need to add more capability to your personal toolkit, you will be learning to Download and install several of the best Gephi layout plugins. You will then use these layouts simultaneously to produce beautiful graphs. Also, you create and import data in Gephi and add some new plugins that extend Gephi even further. You also gain the skills to prepare and customize your network visualization for export.
By the end of this book, you will be able to create your own network graphs using Gephi, customize the look and feel of your graphs, and successfully publish them to the Web.
Wybrane bestsellery
Packt Publishing - inne książki
Dzięki opcji "Druk na żądanie" do sprzedaży wracają tytuły Grupy Helion, które cieszyły sie dużym zainteresowaniem, a których nakład został wyprzedany.
Dla naszych Czytelników wydrukowaliśmy dodatkową pulę egzemplarzy w technice druku cyfrowego.
Co powinieneś wiedzieć o usłudze "Druk na żądanie":
- usługa obejmuje tylko widoczną poniżej listę tytułów, którą na bieżąco aktualizujemy;
- cena książki może być wyższa od początkowej ceny detalicznej, co jest spowodowane kosztami druku cyfrowego (wyższymi niż koszty tradycyjnego druku offsetowego). Obowiązująca cena jest zawsze podawana na stronie WWW książki;
- zawartość książki wraz z dodatkami (płyta CD, DVD) odpowiada jej pierwotnemu wydaniu i jest w pełni komplementarna;
- usługa nie obejmuje książek w kolorze.
Masz pytanie o konkretny tytuł? Napisz do nas: sklep@helion.pl
Książka drukowana


















Oceny i opinie klientów: Network Graph Analysis and Visualization with Gephi. Gephi is a great platform for analyzing and turning your data into highly communicative visualizations, and this book will teach you to create your own network graphs, and then customize and publish them to the web Ken Cherven, Kenneth Michael Cherven
(0)