×
Dodano do koszyka:
Pozycja znajduje się w koszyku, zwiększono ilość tej pozycji:
Zakupiłeś już tę pozycję:
Książkę możesz pobrać z biblioteki w panelu użytkownika
Pozycja znajduje się w koszyku
Przejdź do koszyka

Zawartość koszyka

ODBIERZ TWÓJ BONUS :: »

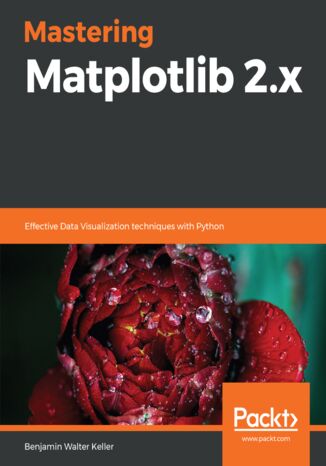
Mastering Matplotlib 2.x. Effective Data Visualization techniques with Python Benjamin Walter Keller
(ebook) (audiobook) (audiobook) Książka w języku 1
Mastering Matplotlib 2.x. Effective Data Visualization techniques with Python Benjamin Walter Keller - okladka książki

Mastering Matplotlib 2.x. Effective Data Visualization techniques with Python Benjamin Walter Keller - okladka książki

Mastering Matplotlib 2.x. Effective Data Visualization techniques with Python Benjamin Walter Keller - audiobook MP3

Mastering Matplotlib 2.x. Effective Data Visualization techniques with Python Benjamin Walter Keller - audiobook CD

Autor:
Benjamin Walter Keller
Ocena:
Bądź pierwszym, który oceni tę książkę
Stron:
214
Dostępne formaty:
     PDF
     ePub
     Mobi

Ebook (80,91 zł najniższa cena z 30 dni)

89,90 zł (-10%)
80,91 zł

Dodaj do koszyka lub Kup na prezent Kup 1-kliknięciem

(80,91 zł najniższa cena z 30 dni)

Przenieś na półkę

Do przechowalni

In this book, you’ll get hands-on with customizing your data plots with the help of Matplotlib. You’ll start with customizing plots, making a handful of special-purpose plots, and building 3D plots. You’ll explore non-trivial layouts, Pylab customization, and more about tile configuration. You’ll be able to add text, put lines in plots, and also handle polygons, shapes, and annotations. Non-Cartesian and vector plots are exciting to construct, and you’ll explore them further in this book. You’ll delve into niche plots and visualize ordinal and tabular data. In this book, you’ll be exploring 3D plotting, one of the best features when it comes to 3D data visualization, along with Jupyter Notebook, widgets, and creating movies for enhanced data representation. Geospatial plotting will also be explored. Finally, you’ll learn how to create interactive plots with the help of Jupyter.
Learn expert techniques for effective data visualization using Matplotlib 3 and Python with our latest offering -- Matplotlib 3.0 Cookbook

Wybrane bestsellery

O autorze książki

Benjamin Walter Keller is currently a PhD candidate at McMaster University and gained his BSc in physics with a minor in computer science from the University of Calgary in 2011. His current research involves numerical modeling of galaxy evolution over cosmological timescales. As an undergraduate at the U of C, he worked on stacking radio polarization to examine faint extragalactic sources. He also worked in the POSSUM Working Group 2 to determine the requirements for stacking applications for the Australian SKA Pathfinder (ASKAP) radio telescope. He is particularly interested in questions involving stellar feedback (supernovae, stellar winds, and so on) and its impact on galaxies and their surrounding intergalactic medium.

Packt Publishing - inne książki

Zamknij

Przenieś na półkę

Proszę czekać...
ajax-loader

Zamknij

Wybierz metodę płatności

Ebook
80,91 zł
Dodaj do koszyka
Zamknij Pobierz aplikację mobilną Ebookpoint
Zabrania się wykorzystania treści strony do celów eksploracji tekstu i danych (TDM), w tym eksploracji w celu szkolenia technologii AI i innych systemów uczenia maszynowego. It is forbidden to use the content of the site for text and data mining (TDM), including mining for training AI technologies and other machine learning systems.