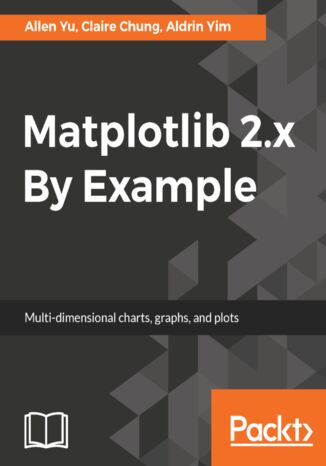
Matplotlib 2.x By Example. Multi-dimensional charts, graphs, and plots in Python Allen Yu, Claire Chung, Aldrin Yim


- Autorzy:
- Allen Yu, Claire Chung, Aldrin Yim
- Wydawnictwo:
- Packt Publishing
- Ocena:
- Stron:
- 334
- Dostępne formaty:
-
PDFePubMobi
Opis
książki
:
Matplotlib 2.x By Example. Multi-dimensional charts, graphs, and plots in Python
Matplotlib 2.x By Example illustrates
the methods and applications of various plot types through real world examples.
It begins by giving readers the basic
know-how on how to create and
customize plots by Matplotlib. It further covers how to plot different types of economic data in the form of 2D and 3D graphs, which give insights from a deluge of data from public repositories, such as Quandl Finance. You will learn to visualize geographical data on maps and implement interactive charts.
By the end of this book, you will become well versed with Matplotlib in your day-to-day work to perform advanced data visualization. This book will guide you to prepare high quality figures for manuscripts and presentations. You will learn to create intuitive info-graphics and reshaping your message crisply understandable.
Wybrane bestsellery
Packt Publishing - inne książki
Dzięki opcji "Druk na żądanie" do sprzedaży wracają tytuły Grupy Helion, które cieszyły sie dużym zainteresowaniem, a których nakład został wyprzedany.
Dla naszych Czytelników wydrukowaliśmy dodatkową pulę egzemplarzy w technice druku cyfrowego.
Co powinieneś wiedzieć o usłudze "Druk na żądanie":
- usługa obejmuje tylko widoczną poniżej listę tytułów, którą na bieżąco aktualizujemy;
- cena książki może być wyższa od początkowej ceny detalicznej, co jest spowodowane kosztami druku cyfrowego (wyższymi niż koszty tradycyjnego druku offsetowego). Obowiązująca cena jest zawsze podawana na stronie WWW książki;
- zawartość książki wraz z dodatkami (płyta CD, DVD) odpowiada jej pierwotnemu wydaniu i jest w pełni komplementarna;
- usługa nie obejmuje książek w kolorze.
Masz pytanie o konkretny tytuł? Napisz do nas: sklep@helion.pl
Książka drukowana













Oceny i opinie klientów: Matplotlib 2.x By Example. Multi-dimensional charts, graphs, and plots in Python Allen Yu, Claire Chung, Aldrin Yim
(0)