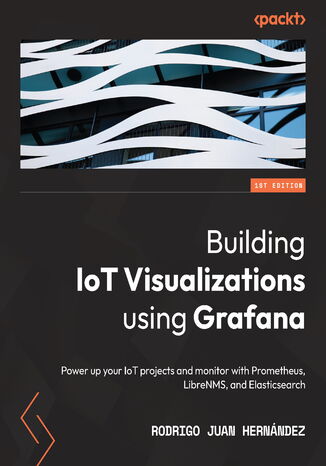
Building IoT Visualizations using Grafana. Power up your IoT projects and monitor with Prometheus, LibreNMS, and Elasticsearch Rodrigo Juan Hernández


- Autor:
- Rodrigo Juan Hernández
- Wydawnictwo:
- Packt Publishing
- Ocena:
- Stron:
- 360
- Dostępne formaty:
-
PDFePub
Opis
książki
:
Building IoT Visualizations using Grafana. Power up your IoT projects and monitor with Prometheus, LibreNMS, and Elasticsearch
Building IoT Visualizations Using Grafana offers how-to procedures, useful resources, and advice that will help you to implement IoT solutions with confidence. You’ll begin by installing and configuring Grafana according to your needs. Next, you’ll acquire the skills needed to implement your own IoT system using communication brokers, databases, and metric management systems, as well as integrate everything with Grafana. You’ll learn to collect data from IoT devices and store it in databases, as well as discover how to connect databases to Grafana, make queries, and build insightful dashboards. Finally, the book will help you implement analytics for visualizing data, performing automation, and delivering notifications.
By the end of this Grafana book, you’ll be able to build insightful dashboards, perform analytics, and deliver notifications that apply to IoT and IT systems.
Wybrane bestsellery
Packt Publishing - inne książki
Dzięki opcji "Druk na żądanie" do sprzedaży wracają tytuły Grupy Helion, które cieszyły sie dużym zainteresowaniem, a których nakład został wyprzedany.
Dla naszych Czytelników wydrukowaliśmy dodatkową pulę egzemplarzy w technice druku cyfrowego.
Co powinieneś wiedzieć o usłudze "Druk na żądanie":
- usługa obejmuje tylko widoczną poniżej listę tytułów, którą na bieżąco aktualizujemy;
- cena książki może być wyższa od początkowej ceny detalicznej, co jest spowodowane kosztami druku cyfrowego (wyższymi niż koszty tradycyjnego druku offsetowego). Obowiązująca cena jest zawsze podawana na stronie WWW książki;
- zawartość książki wraz z dodatkami (płyta CD, DVD) odpowiada jej pierwotnemu wydaniu i jest w pełni komplementarna;
- usługa nie obejmuje książek w kolorze.
Masz pytanie o konkretny tytuł? Napisz do nas: sklep@helion.pl
Książka drukowana






















Oceny i opinie klientów: Building IoT Visualizations using Grafana. Power up your IoT projects and monitor with Prometheus, LibreNMS, and Elasticsearch Rodrigo Juan Hernández
(0)