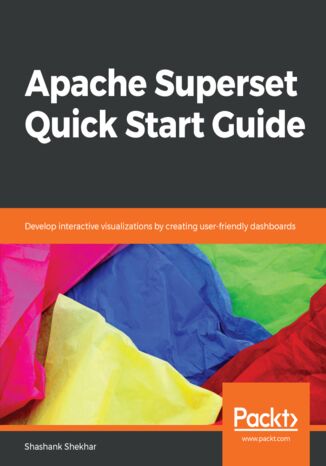
Apache Superset Quick Start Guide. Develop interactive visualizations by creating user-friendly dashboards Shashank Shekhar


- Autor:
- Shashank Shekhar
- Wydawnictwo:
- Packt Publishing
- Ocena:
- Stron:
- 188
- Dostępne formaty:
-
PDFePubMobi
Opis
książki
:
Apache Superset Quick Start Guide. Develop interactive visualizations by creating user-friendly dashboards
First, we look at the fundamentals of Superset, and then get it up and running. You'll go through the requisite installation, configuration, and deployment. Then, we will discuss different columnar data types, analytics, and the visualizations available. You'll also see the security tools available to the administrator to keep your data safe.
You will learn how to visualize relationships as graphs instead of coordinates on plain orthogonal axes. This will help you when you upload your own entity relationship dataset and analyze the dataset in new, different ways. You will also see how to analyze geographical regions by working with location data.
Finally, we cover a set of tutorials on dashboard designs frequently used by analysts, business intelligence professionals, and developers.
Wybrane bestsellery
Packt Publishing - inne książki
Dzięki opcji "Druk na żądanie" do sprzedaży wracają tytuły Grupy Helion, które cieszyły sie dużym zainteresowaniem, a których nakład został wyprzedany.
Dla naszych Czytelników wydrukowaliśmy dodatkową pulę egzemplarzy w technice druku cyfrowego.
Co powinieneś wiedzieć o usłudze "Druk na żądanie":
- usługa obejmuje tylko widoczną poniżej listę tytułów, którą na bieżąco aktualizujemy;
- cena książki może być wyższa od początkowej ceny detalicznej, co jest spowodowane kosztami druku cyfrowego (wyższymi niż koszty tradycyjnego druku offsetowego). Obowiązująca cena jest zawsze podawana na stronie WWW książki;
- zawartość książki wraz z dodatkami (płyta CD, DVD) odpowiada jej pierwotnemu wydaniu i jest w pełni komplementarna;
- usługa nie obejmuje książek w kolorze.
Masz pytanie o konkretny tytuł? Napisz do nas: sklep@helion.pl
Książka drukowana



















Oceny i opinie klientów: Apache Superset Quick Start Guide. Develop interactive visualizations by creating user-friendly dashboards Shashank Shekhar
(0)