×
Dodano do koszyka:
Pozycja znajduje się w koszyku, zwiększono ilość tej pozycji:
Zakupiłeś już tę pozycję:
Książkę możesz pobrać z biblioteki w panelu użytkownika
Pozycja znajduje się w koszyku
Przejdź do koszyka

Zawartość koszyka

ODBIERZ TWÓJ BONUS :: »

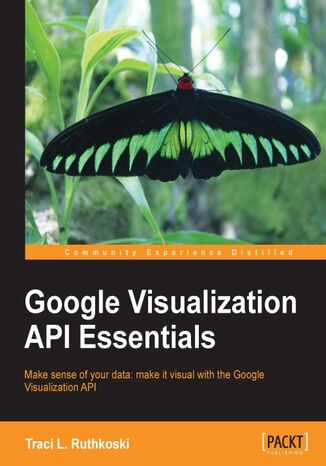
Google Visualization API Essentials. Make sense of your data: make it visual with the Google Visualization API Traci Lynn Ruthkoski
(ebook) (audiobook) (audiobook) Książka w języku angielskim
Google Visualization API Essentials. Make sense of your data: make it visual with the Google Visualization API Traci Lynn Ruthkoski - okladka książki

Google Visualization API Essentials. Make sense of your data: make it visual with the Google Visualization API Traci Lynn Ruthkoski - okladka książki

Google Visualization API Essentials. Make sense of your data: make it visual with the Google Visualization API Traci Lynn Ruthkoski - audiobook MP3

Google Visualization API Essentials. Make sense of your data: make it visual with the Google Visualization API Traci Lynn Ruthkoski - audiobook CD

Autor:
Traci Lynn Ruthkoski
Ocena:
Bądź pierwszym, który oceni tę książkę
Stron:
252
Dostępne formaty:
     PDF
     ePub
     Mobi
Zostało Ci na świąteczne zamówienie opcje wysyłki »
There's a lot of data in our world, and visual representations are often the best method of making sense of it all. Yet, it should not take an army of programmers and analysts to create visualizations in order to make data useful. The Google Visualization API is accessible to novice and advanced programmers alike, making data useful to more people.Google Visualization API Essentials will show you how to create interactive data displays with very little code. The API, combined with Google Spreadsheets and Fusion Tables, is a complete system, from data management to analytical displays. Not only is it simple to learn, but the Google Visualization API can also be viewed as a first step to learning additional Google APIs.Google Visualization API Essentials uses both methodology overviews and hands-on examples with real data to introduce chart and graph creation on the Google platform. Topics are presented from various aspects, including Google Spreadsheets and Fusion Tables, and Graphic User Interfaces. An overview of the various API development environments available to developers is also covered. Basic and advanced charts, data source connectivity, style formatting, and publishing options are also explored in depth.Google Visualization API Essentials brings the arsenal of Google Visualizations into the web developer toolkit.

Wybrane bestsellery

O autorze książki

Traci L. Ruthkoski is from an eclectic background in computation, statistics, media technology, and business. Traci is always looking for the latest challenges in technology. Having worked as an IT professional in both clinical and medical research settings, she has built High Performance Computing clusters from hardware to software application. More recently, Traci has been enabling academic research advancement through computing and cyber infrastructure in the cloud domain. She continues to work at the University of Michigan, now holding several roles supporting the overall advancement of Research Cyber Infrastructure and Information Technology at the University. Traci has published academic work in the IEEE CloudCom 2010 proceedings as well as maintaining a blog/tutorial repository for cloud computing tools and trends.

Packt Publishing - inne książki

Zamknij

Przenieś na półkę

Proszę czekać...
ajax-loader

Zamknij

Wybierz metodę płatności

Ebook
125,10 zł
Dodaj do koszyka
Zamknij Pobierz aplikację mobilną Ebookpoint
Zabrania się wykorzystania treści strony do celów eksploracji tekstu i danych (TDM), w tym eksploracji w celu szkolenia technologii AI i innych systemów uczenia maszynowego. It is forbidden to use the content of the site for text and data mining (TDM), including mining for training AI technologies and other machine learning systems.