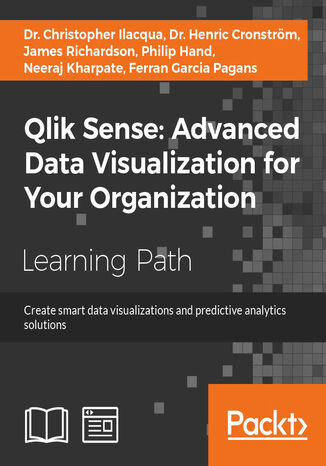
Qlik Sense: Advanced Data Visualization for Your Organization


- Ocena:
- Bądź pierwszym, który oceni tę książkę
- Stron:
- 764
- Dostępne formaty:
-
PDFePub
Opis książki: Qlik Sense: Advanced Data Visualization for Your Organization
Qlik Sense is powerful and creative visual analytics software that allows users to discover data, explore it, and dig out meaningful insights in order to make a profit and make decisions for your business. This course begins by introducing you to the features and functions of the most modern edition of Qlik Sense so you get to grips with the application.
The course will teach you how to administer the data architecture in Qlik Sense, enabling you to customize your own Qlik Sense application for your business intelligence needs. It also contains numerous recipes to help you overcome challenging situations while creating fully featured desktop applications in Qlik Sense. It explains how to combine Rattle and Qlik Sense Desktop to apply predictive analytics to your data to develop real-world interactive data applications. The course includes premium content from three of our most popular books:
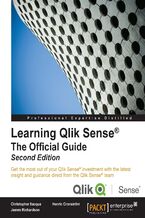
[*] Learning Qlik Sense: The Official Guide Second Edition
[*] Qlik Sense Cookbook
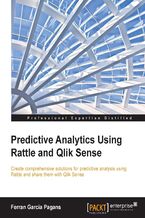
[*] Predictive Analytics using Rattle and Qlik Sense
On completion of this course, you will be self-sufficient in improving your data analysis and will know how to apply predictive analytics to your datasets. Through this course, you will be able to create predictive models and data applications, allowing you to explore your data insights much deeper.
Wybrane bestsellery
-
Create dynamic dashboards to perform interactive analytics for business intelligence operations Key Features Explore newly added features in Qlik Sense Discover best practices to work with data using Qlik Sense Learn to implement advanced functions for better data insight Book Description Ql...
-
Dzięki tej książce nauczysz się przekształcać suche dane liczbowe w pełną empatii narrację! Aby spełniły one swoje zadanie, ktoś musi przedstawić zawarte w nich informacje w postaci opowieści. W tej publikacji wyczerpująco i praktycznie opisano przebieg tego procesu. Jej lektura sprawi, że rozwin...
Opowieści ukryte w danych. Wyjaśnij dane i wywołaj działania za pomocą narracji Opowieści ukryte w danych. Wyjaśnij dane i wywołaj działania za pomocą narracji
(0,00 zł najniższa cena z 30 dni)20.90 zł
67.00 zł(-69%) -
Metody statystyczne są kluczowym elementem data science, mimo to niewielu specjalistów data science posiada formalne wykształcenie statystyczne. Kursy i podręczniki o podstawach statystyki, rzadko kiedy omawiają temat z perspektywy data science. W drugim wydaniu tego popularnego podręcznika zosta...
Statystyka praktyczna w data science. 50 kluczowych zagadnień w językach R i Python. Wydanie II Statystyka praktyczna w data science. 50 kluczowych zagadnień w językach R i Python. Wydanie II
(0,00 zł najniższa cena z 30 dni)41.40 zł
69.00 zł(-40%) -
BPMN pozwala na ciągłe analizowanie, monitorowanie i optymalizowanie procesów biznesowych. Jest narzędziem bardzo skutecznym, prawdziwym „świętym Graalem” współczesnego biznesu. Jednak nie jest on niestety tak przyjazny, jak mógłby oczekiwać początkujący użytkownik. Jego oryginalną sp...
Zrozumieć BPMN. Modelowanie procesów biznesowych. Wydanie 2 rozszerzone Zrozumieć BPMN. Modelowanie procesów biznesowych. Wydanie 2 rozszerzone
(0,00 zł najniższa cena z 30 dni)29.40 zł
49.00 zł(-40%) -
Ta książka jest przewodnikiem dla każdego, kto musi przekazywać informacje, robiąc przy tym użytek z danych. Szczególnie wartościowa będzie dla analityków, studentów i naukowców, a także dla każdego, kto w swojej komunikacji odwołuje się do danych. Pokazano tu prostą i intuicyjną technikę przedst...
Storytelling danych. Poradnik wizualizacji danych dla profesjonalistów Storytelling danych. Poradnik wizualizacji danych dla profesjonalistów
(0,00 zł najniższa cena z 30 dni)46.20 zł
77.00 zł(-40%) -
To drugie, w pełni zaktualizowane wydanie znakomitego przewodnika, dzięki któremu bezproblemowo rozpoczniesz pracę z Power BI i w pełni wykorzystasz jego możliwości. Dowiesz się, jak pozyskiwać i oczyszczać dane z różnych źródeł, a także jak zaprojektować model danych, aby móc analizować relacje ...
Microsoft Power BI. Jak modelować i wizualizować dane oraz budować narracje cyfrowe. Wydanie II Microsoft Power BI. Jak modelować i wizualizować dane oraz budować narracje cyfrowe. Wydanie II
Devin Knight, Mitchell Pearson, Bradley Schacht, Erin Ostrowsky
(0,00 zł najniższa cena z 30 dni)46.20 zł
77.00 zł(-40%) -
Termin business intelligence ostatnimi czasy jest odmieniany przez wszystkie przypadki. Według raportu Gartnera z 2020 roku aktualnie liderem w dziedzinie narzędzi BI jest Microsoft - ten kurs video oferuje możliwość zapoznania się z jednym z nich. Power BI, bo o nim mowa, pozwala efektywnie anal...
Power BI Desktop. Kurs video. Wykorzystanie narzędzia w analizie i wizualizacji danych Power BI Desktop. Kurs video. Wykorzystanie narzędzia w analizie i wizualizacji danych
(0,00 zł najniższa cena z 30 dni)224.25 zł
299.00 zł(-25%) -
Data is at the center of many challenges in system design today. Difficult issues need to be figured out, such as scalability, consistency, reliability, efficiency, and maintainability. In addition, we have an overwhelming variety of tools, including relational databases, NoSQL datastores, stream...
Designing Data-Intensive Applications. The Big Ideas Behind Reliable, Scalable, and Maintainable Systems Designing Data-Intensive Applications. The Big Ideas Behind Reliable, Scalable, and Maintainable Systems
(0,00 zł najniższa cena z 30 dni)203.15 zł
239.00 zł(-15%) -
W tym przewodniku opisano zagadnienia związane z podstawami nauki o danych. Wyjaśniono niezbędne elementy matematyki i statystyki. Przedstawiono także techniki budowy potrzebnych narzędzi i sposoby działania najistotniejszych algorytmów. Książka została skonstruowana tak, aby poszczególne impleme...
Data science od podstaw. Analiza danych w Pythonie. Wydanie II Data science od podstaw. Analiza danych w Pythonie. Wydanie II
(0,00 zł najniższa cena z 30 dni)47.40 zł
79.00 zł(-40%) -
Według raportu Digital 2022 liczba internautów to ponad 62% światowej populacji. Są nas miliardy i w krótkim czasie produkujemy miliardy danych. We współczesnym świecie zbiory danych postrzegane są niemal jak złoto, determinują bowiem kierunek rozwoju gospodarki. Jednakże tylko odpowiednio przetw...
Analiza danych w Pythonie. Kurs video. Pracuj z Jupyter, Pandas i Matplotlib Analiza danych w Pythonie. Kurs video. Pracuj z Jupyter, Pandas i Matplotlib
(0,00 zł najniższa cena z 30 dni)74.50 zł
149.00 zł(-50%)
Ebooka przeczytasz na:
-
czytnikach Inkbook, Kindle, Pocketbook i innych
-
systemach Windows, MacOS i innych
-
systemach Windows, Android, iOS, HarmonyOS
-
na dowolnych urządzeniach i aplikacjach obsługujących formaty: PDF, EPub, Mobi
Masz pytania? Zajrzyj do zakładki Pomoc »
Audiobooka posłuchasz:
-
w aplikacji Ebookpoint na Android, iOS, HarmonyOs
-
na systemach Windows, MacOS i innych
-
na dowolonych urządzeniach i aplikacjach obsługujących format MP3 (pliki spakowane w ZIP)
Masz pytania? Zajrzyj do zakładki Pomoc »
Kurs Video zobaczysz:
-
w aplikacji Ebookpoint na Android, iOS, HarmonyOs
-
na systemach Windows, MacOS i innych
-
na dowolonych urządzeniach i aplikacjach obsługujących format MP4 (pliki spakowane w ZIP)
Szczegóły książki
- Tytuł oryginału:
- Qlik Sense: Advanced Data Visualization for Your Organization
- ISBN Ebooka:
- 978-17-889-9872-7, 9781788998727
- Data wydania ebooka:
-
2017-12-27
Data wydania ebooka często jest dniem wprowadzenia tytułu do sprzedaży i może nie być równoznaczna z datą wydania książki papierowej. Dodatkowe informacje możesz znaleźć w darmowym fragmencie. Jeśli masz wątpliwości skontaktuj się z nami sklep@helion.pl.
- Język publikacji:
- angielski
- Rozmiar pliku Pdf:
- 17.5MB
- Rozmiar pliku ePub:
- 47.4MB
- Kategorie:
Big Data » Analiza danych
Spis treści książki
- Qlik Sense: Advanced Data Visualization for Your Organization
- Table of Contents
- Qlik Sense: Advanced Data Visualization for Your Organization
- Credits
- Preface
- What this learning path covers
- What you need for this learning path
- Who this learning path is for
- Reader feedback
- Customer support
- Downloading the example code
- Errata
- Piracy
- Questions
- 1. Module 1
- 1. Qlik Sense and Data Discovery
- Continuing disruption
- Qlik Sense and the QlikView.Next project
- Making sense of modern business
- What is data discovery?
- The empowered user
- Interaction with data
- Traditional business intelligence architecture
- 1. Qlik Sense and Data Discovery
- The Qlik way
- Color coding
- Freedom of data navigation
- Calculation on demand
- Data discoverythe evolution of BI
- Summary
- 2. Overview of a Qlik Sense Applications Life Cycle
- Overview of an application's life cycle
- Starting application authoring
- What makes up a Qlik Sense application?
- Sharing an application
- Continuing the application's life cycle
- Overview of an application's life cycle
- Summary
- 3. Empowering Next Generation Data Discovery Consumers
- Data discovery consumption requirements
- Introducing the hub
- Introducing streams
- Exploring the components of the application
- Sheets
- Bookmarks
- Data storytelling
- Navigating and leveraging the associative experience
- Navigation
- Smart visualizations
- Global search
- Global filtering
- Data discovery consumption requirements
- Extending with Library
- Summary
- 4. Contributing to Data Discovery
- Realities of the data discovery contributor
- Creating private bookmarks
- Creating and sharing private sheets
- Creating a private sheet
- Publishing a private sheet
- Creating a private sheet
- Creating a new sheet
- Adding a predefined visualization to a new sheet
- Creating a Combo chart object
- Publishing a private sheet
- Realities of the data discovery contributor
- Creating and sharing stories
- Defining a story
- Creating snapshots
- Adding text
- Adding shapes
- Media library
- Defining a story
- Publishing your story
- Summary
- 5. Authoring Engaging Applications
- Preparations and requirements
- The requirement specifications
- The communication problem
- A step-wise implementation
- The process
- Preparations and requirements
- Getting started with the app creation
- Creating a new app
- Loading your data
- Loading additional tables
- Using the Data load editor
- Creating a database connection
- Data connectors
- The analysis interfacesheets and visualizations
- Creating a sheet
- Adding visualizations
- Adding dimensions and measures
- Defining bar charts
- Storytelling
- The application library
- Which fields should be exposed?
- Defining KPIs
- Creating library entries
- Best practices in data visualization
- Dashboard
- Analysis
- Reporting
- Structuring a sheet
- Graphs and other visualizations
- Dimensions and measures
- The bar chart
- The pie chart
- The line chart
- The KPI object
- The gauge
- The scatter chart
- The tree map
- The geographical map
- Tables
- Sorting and colors
- Migrating applications from QlikView to Qlik Sense
- Changes to the script
- Changes to the user interface
- Publishing your apps
- Summary
- 6. Building Qlik Sense Data Models
- The QIX engine
- The Qlik Sense data model
- Creating a multitable data model
- Linking tables
- Structuring your data
- Normalization
- Star schema and snowflake schema
- Pitfalls in the data model
- The data model viewer
- Using preview mode
- Summary
- 7. Qlik Sense Apps in the Cloud
- Why use the cloud?
- Cloud sharing
- Cloud content
- Why use the cloud?
- Using Qlik Sense apps in the cloud
- Uploading an app from the desktop
- Creating an app in Qlik Sense Cloud
- Sharing an app in Qlik Sense Cloud
- Maintaining Qlik Sense Cloud apps
- Using the Qlik DataMarket content
- Adding the QlikMarket data
- Summary
- 8. Extending the Qlik Analytic Platform
- Qlik Dev Hub
- Web mashups
- Extending the Qlik Sense client
- Engine API Explorer
- Qlik Dev Hub
- Developer community Qlik Branch
- Summary
- 9. Administering Qlik Sense
- The Qlik Sense architecture
- Services
- Clients
- Applications
- Nodes
- Streams
- The Qlik Sense architecture
- Deployment and licensing
- Single node or multinode
- License and access passes
- Tokens
- Access rules
- Management and monitoring
- Importing and managing apps
- Importing extensions
- Users and user directories
- Defining streams
- Connectivity management
- Tasks
- System management
- Security rules
- Monitoring
- Security
- Authentication and authorization
- Content security
- Summary
- 10. Sales Discovery
- The business problem
- Application features
- Who are our top customers?
- The 360-degree customer view
- Filtering customers
- Reviewing shipments for top customers
- Reviewing the bottom five customers
- Who are our most productive sales representatives?
- Analyzing products
- Analyzing customer sales
- Building the application
- The SalesDetails table
- The Customers table
- The AggSales table
- US States ISO CODE 2 polygons
- Analyzing the Sales Discovery Library
- Dimensions
- Measures
- Visualizations
- Summary
- 11. Human Resource Discovery
- The business problem
- Application features
- Sheets
- Training costs
- Using the global selector
- How the application was developed
- Dimensions
- Summary
- 12. Travel Expense Discovery
- The business problem
- Application features
- Tracking expenses
- Analyzing expenses overspent
- Tracking expenses
- Digging deeper into the data
- Creating an analysis story for travel expenses
- Creating an overview
- Sharing our analysis
- Finishing the story
- Creating an analysis story for travel expenses
- Developing the application
- Examining the key tables
- Expenses
- PerDiemRates
- Airfare
- Department
- Budget
- LinkTable
- Examining the key tables
- Dimensions
- Measures
- Visualizations
- Summary
- 13. Demographic Data Discovery
- Problem analysis
- Application features
- Analysis
- Using the lasso selector to make selections
- Using the global selector to make selections
- How the application was developed
- Dimensions
- Measures
- Summary
- 2. Module 2
- 1. Getting Started with the Data
- Introduction
- Extracting data from databases and data files
- Getting ready
- How to do it
- How it works
- There's more
- See also
- Extracting data from Web Files
- Getting ready
- How to do it
- How it works
- There's more
- See also
- 1. Getting Started with the Data
- Activating the Legacy Mode in Qlik Sense desktop
- Getting ready
- How to do it
- How it works
- There's more
- See also
- Extracting data from custom databases
- Getting ready
- How to do it
- How it works
- There's more
- See also
- Invoking help while in the data load editor or the expression editor
- Getting ready
- How to do it
- There's more
- See also
- Previewing data in the Data model viewer
- Getting ready
- How to do it
- How it works...
- Viewing the data model
- Viewing the associations
- Table Meta Data
- There's more...
- Creating a Master Library from the Data model viewer
- Getting ready
- How to do it...
- How it works...
- There's more
- Using a Master Library in the Edit mode
- Getting ready
- How to do it...
- There's more
- 2. Visualizations
- Introduction
- Creating Snapshots
- Getting ready
- How to do it
- How it works
- There's more
- See also
- Creating and adding content to a story
- Getting ready
- How to do it
- How it works
- There's more
- See also
- Adding embedded sheets to the story
- Getting ready
- How to do it
- How it works
- There's more
- Highlighting the performance measure in a bar chart
- Getting ready
- How to do it
- How it works
- There's more
- See also
- Associating persistent colors to field values
- Getting ready
- How to do it
- How it works
- There's more
- See also
- Using the ColorMix1 function
- Getting ready
- How to do it
- How it works
- There's more
- See also
- Composition
- Getting ready
- How to do it
- How it works
- There's more
- Relationships
- Getting ready
- How to do it
- How it works
- Comparison
- Getting ready
- How to do it
- How it works
- See also
- Distribution
- Getting ready
- How to do it
- How it works
- Structuring visualizations
- Getting ready
- How to do it
- How it works
- 3. Scripting
- Introduction
- Structuring the script
- Getting ready
- How to do it
- How it works
- Efficiently debugging the script
- Getting ready
- How to do it
- How it works
- There's more
- See also
- Packaging the code in script files
- Getting ready
- How to do it
- How it works
- See also
- How to use sub routines in Qlik Sense
- Getting ready
- How to do it
- How it works
- There's more
- See also
- Optimizing the UI calculation speed
- Getting ready
- How to do it
- How it works
- Optimizing the reload time of the application
- Getting ready
- How to do it
- How it works
- Using a For Each loop to load data from multiple files
- Getting ready
- How to do it
- How it works
- There's more
- Using the Concat function to store multiple field values in a single cell
- Getting ready
- How to do it
- How it works
- There's more
- See also
- 4. Managing Apps and User Interface
- Introduction
- Publishing a Qlik Sense application created in Qlik Sense desktop
- Getting ready
- How to do it
- How it works
- There's more
- Creating private, approved, and community sheets
- Getting ready
- How to do it
- How it works
- There's more
- See also
- Publishing a Qlik Sense application to Qlik Sense cloud
- Getting ready
- How to do it
- How it works
- There's more
- Creating geo maps in Qlik Sense
- Getting ready
- How to do it
- How it works
- There's more
- Reference lines in Sales versus Target gauge chart
- Getting ready
- How to do it
- How it works
- There's more
- See also
- Effectively using the KPI object in Qlik Sense
- Getting ready
- How to do it
- How it works
- There's more
- See also
- Creating Tree Maps
- Getting ready
- How to do it
- How it works
- There's more
- Creating dimensionless bar charts in Qlik Sense
- Getting ready
- How to do it
- How it works
- There's more
- See also
- Adding Reference Lines to trendline charts
- Getting ready
- How to do it
- How it works
- Creating text and images
- Getting ready
- How to do it
- Adding Images
- Adding Text
- How it works
- Applying limitations to charts
- Getting ready
- How to do it
- How it works
- There's more
- Adding thumbnails a clear environment
- Getting ready
- How to do it
- How it works
- Navigating many data points in a scatter chart
- Getting ready
- How to do it
- How it works
- There's more
- 5. Useful Functions
- Introduction
- Using an extended interval match to handle Slowly Changing Dimensions
- Getting ready
- How to do it
- How it works
- There's more
- See also
- Using the Previous() function to identify the latest record for a dimensional value
- Getting ready
- How to do it
- How it works
- There's more
- See also
- Using the NetworkDays() function to calculate the working days in a calendar month
- Getting ready
- How to do it
- How it works
- See also
- Using the Concat() function to display a string of field values as a dimension
- Getting ready
- How to do it
- How it works
- There's more
- See also
- Using the Minstring() function to calculate the age of the oldest case in a queue
- Getting ready
- How to do it
- How it works
- There's more
- See also
- Using the Rangesum() function to plot cumulative figures in trendline charts
- Getting ready
- How to do it
- How it works
- See also
- Using the Fractile() function to generate quartiles
- Getting ready
- How to do it
- How it works
- There's more
- See also
- Using the FirstSortedValue() function to identify the median in a quartile range
- Getting ready
- How to do it
- How it works
- There's more
- See also
- Using the Declare and Derive functions to generate Calendar fields
- Getting ready
- How to do it
- How it works
- There's more
- See also
- Setting up a moving annual total figure
- Getting ready
- How to do it
- How it works
- There's more
- See also
- Using the For Each loop to extract files from a folder
- Getting ready
- How to do it
- How it works
- Using the Peek() function to create a currency Exchange Rate Calendar
- Getting ready
- How to do it
- How it works
- There's more
- See also
- Using the Peek() function to create a Trial Balance sheet
- Getting ready
- How to do it
- How it works
- See also
- 6. Set Analysis
- Introduction
- Cracking the syntax for Set Analysis
- Getting ready
- How to do it
- How it works
- There's more
- See also
- Using flags in Set Analysis
- Getting ready
- How to do it
- How it Works
- There's more
- See also
- Using the = sign with variables in Set Analysis
- Getting ready
- How to do it
- How it works
- See also
- Point in time using Set Analysis
- Getting ready
- How to do it
- How it works
- Using comparison sets in Set Analysis
- Getting ready
- How to do it
- How it works
- Using embedded functions in Set Analysis
- Getting ready
- How to do it
- How it works
- There's more
- Creating a multi-measure expression in Set Analysis
- Getting ready
- How to do it
- How it works
- Using search strings inside a set modifier
- Getting ready
- How to do it
- How it works
- There's more
- See also
- Capturing a list of field values using a concat() function in Set Analysis
- Getting ready
- How to do it
- How it works
- Using the element functions P() and E() in Set Analysis
- Getting ready
- How to do it
- How it works
- There's more
- See also
- 7. Extensions in Qlik Sense
- Introduction
- Creating an HTML visualization extension for Qlik Sense
- Getting ready
- How to do it
- How it works
- There's more
- See also
- Defining a Properties panel in Qlik Sense visualizations
- Getting ready
- How to do it
- How it works
- There's more
- Creating custom components within Qlik Sense visualizations
- Getting ready
- How to do it
- How it works
- There's more
- Using data with extensions
- Getting ready
- How to do it
- How it works
- See also
- 8. What's New in Version 2.1.1?
- Introduction
- Using the visual exploration capability in Qlik Sense 2.1.1
- Getting ready
- How to do it
- How it works
- There's more
- See also
- Defining variables in Qlik Sense
- Getting ready
- How to do it
- How it works
- There's more
- See also
- Exporting stories to MS PowerPoint
- Getting ready
- How to do it
- How it works
- There's more
- See also
- Using the Qlik Dev Hub in Qlik Sense 2.1.1
- Getting ready
- How to do it
- Single configurator
- Extensions editor
- Mashup editor
- How it works
- There's more
- Single configurator
- Extension editor
- See also
- Using Extension editor in Qlik Dev Hub
- Getting ready
- How to do it
- How it works
- There's more
- See also
- Using Qlik Dev Hub to generate mashups
- Getting ready
- How to do it
- How it works
- There's more
- See also
- Embedding Qlik Sense application on a website using a single configurator
- Getting ready
- How to do it
- How it works
- There's more
- See also
- Using the Qlik DataMarket
- Getting ready
- How to do it
- How it works
- See also
- Creating dynamic charts in Qlik Sense
- Getting ready
- How to do it
- How it works
- There's More.
- Using Smart Search
- Getting ready
- How to do it
- How it works
- There's More.
- See also
- Using smart data load profiling
- Getting ready
- How to do it
- How it works
- There's More.
- Conclusion
- A. Appendix
- Keyboard shortcuts in Qlik Sense Desktop
- 3. Module 3
- 1. Getting Ready with Predictive Analytics
- Analytics, predictive analytics, and data visualization
- Purpose of the book
- Introducing R, Rattle, and Qlik Sense Desktop
- Installing the environment
- Downloading and installing R
- Starting the R Console to test your R installation
- Downloading and installing Rattle
- Installing Qlik Sense Desktop
- Exploring Qlik Sense Desktop
- Further learning
- Summary
- 1. Getting Ready with Predictive Analytics
- 2. Preparing Your Data
- Datasets, observations, and variables
- Loading data
- Loading a CSV File
- Transforming data
- Transforming data with Rattle
- Rescaling data
- Using the Impute option to deal with missing values
- Recoding variables
- Binning
- Transforming data with Rattle
- Indicator variables
- Join Categories
- As Category
- As Numeric
- Cleaning up
- Exporting data
- Further learning
- Summary
- 3. Exploring and Understanding Your Data
- Text summaries
- Summary reports
- Measures of central tendency mean, median, and mode
- Measures of dispersion range, quartiles, variance, and standard deviation
- Range
- Quartiles
- Variance
- Standard deviation
- Measures of the shape of the distribution skewness and kurtosis
- Summary reports
- Text summaries
- Showing missing values
- Visualizing distributions
- Numeric variables
- Box plots
- Histograms
- Cumulative plots
- Numeric variables
- Categorical variables
- Bar plots
- Mosaic plots
- Correlations among input variables
- The Explore Missing and Hierarchical options
- Further learning
- Summary
- 4. Creating Your First Qlik Sense Application
- Customer segmentation and customer buying behavior
- Loading data and creating a data model
- Preparing the data
- Creating a simple data app
- Associative logic
- Creating charts
- Analyzing your data
- Further learning
- Summary
- 5. Clustering and Other Unsupervised Learning Methods
- Machine learning unsupervised and supervised learning
- Cluster analysis
- Centroid-based clustering the using K-means algorithm
- Customer segmentation with K-means clustering
- Preparing the data in Qlik Sense
- Creating a customer segmentation sheet in Qlik Sense
- Cluster analysis
- Machine learning unsupervised and supervised learning
- Hierarchical clustering
- Association analysis
- Further learning
- Summary
- 6. Decision Trees and Other Supervised Learning Methods
- Partitioning datasets and model optimization
- Decision Tree Learning
- Entropy and information gain
- Underfitting and overfitting
- Using a Decision Tree to classify credit risks
- Using Rattle to score new loan applications
- Creating a Qlik Sense application to predict credit risks
- Ensemble classifiers
- Boosting
- Random Forest
- Supported Vector Machines
- Other models
- Linear and Logistic Regression
- Neural Networks
- Further learning
- Summary
- 7. Model Evaluation
- Cross-validation
- Regression performance
- Predicted versus Observed Plot
- Measuring the performance of classifiers
- Confusion matrix, accuracy, sensitivity, and specificity
- Risk Chart
- ROC Curve
- Further learning
- Summary
- 8. Visualizations, Data Applications, Dashboards, and Data Storytelling
- Data visualization in Qlik Sense
- Visualization toolbox
- Creating a bar chart
- The Data menu
- The Sorting menu
- The Add-ons menu
- The Appearance menu
- Data visualization in Qlik Sense
- Data analysis, data applications, and dashboards
- Qlik Sense data analysis
- In-memory analysis
- Associative experience
- Qlik Sense data analysis
- Data applications and dashboards
- The DAR approach
- Data storytelling with Qlik Sense
- Creating a new story
- Further learning
- Summary
- 9. Developing a Complete Application
- Understanding the bike rental problem
- Exploring the data with Qlik Sense
- Checking for temporal patterns
- Visual correlation analysis
- Creating a Qlik Sense App to control the activity
- Using Rattle to forecast the demand
- Correlation Analysis with Rattle
- Building a model
- Improving performance
- Model evaluation
- Scoring new data
- Further learning
- Summary
- A. Bibliography
- Index
Packt Publishing - inne książki
-
Solve classic computer science problems from fundamental algorithms, such as sorting and searching, to modern algorithms in machine learning and cryptography
40 Algorithms Every Programmer Should Know - Second Edition 40 Algorithms Every Programmer Should Know - Second Edition
-
Use modern Python libraries such as pandas, NumPy, and scikit-learn and popular machine learning and deep learning methods to solve financial modeling problems
-
Get up to speed with Oracle's Autonomous Databases and implementation strategies for any workload or use case, including transactional, data warehousing, and non-relational databases
Oracle Autonomous Database in Enterprise Architecture Oracle Autonomous Database in Enterprise Architecture
-
Design, build, and deploy performant and maintainable web applications using Spring, Spring Boot, and Angular
-
Build CD pipelines following GitOps principles like declarative and immutable changes stored in version control, all continuously reconciled by Argo CD, and minimize the failure of deployments.
Dzieki opcji "Druk na żądanie" do sprzedaży wracają tytuły Grupy Helion, które cieszyły sie dużym zainteresowaniem, a których nakład został wyprzedany.
Dla naszych Czytelników wydrukowaliśmy dodatkową pulę egzemplarzy w technice druku cyfrowego.
Co powinieneś wiedzieć o usłudze "Druk na żądanie":
- usługa obejmuje tylko widoczną poniżej listę tytułów, którą na bieżąco aktualizujemy;
- cena książki może być wyższa od początkowej ceny detalicznej, co jest spowodowane kosztami druku cyfrowego (wyższymi niż koszty tradycyjnego druku offsetowego). Obowiązująca cena jest zawsze podawana na stronie WWW książki;
- zawartość książki wraz z dodatkami (płyta CD, DVD) odpowiada jej pierwotnemu wydaniu i jest w pełni komplementarna;
- usługa nie obejmuje książek w kolorze.
W przypadku usługi "Druk na żądanie" termin dostarczenia przesyłki może obejmować także czas potrzebny na dodruk (do 10 dni roboczych)
Masz pytanie o konkretny tytuł? Napisz do nas: sklep[at]helion.pl.
Książka, którą chcesz zamówić pochodzi z końcówki nakładu. Oznacza to, że mogą się pojawić drobne defekty (otarcia, rysy, zagięcia).
Co powinieneś wiedzieć o usłudze "Końcówka nakładu":
- usługa obejmuje tylko książki oznaczone tagiem "Końcówka nakładu";
- wady o których mowa powyżej nie podlegają reklamacji;
Masz pytanie o konkretny tytuł? Napisz do nas: sklep[at]helion.pl.


Oceny i opinie klientów: Qlik Sense: Advanced Data Visualization for Your Organization Philip Hand, James Richardson, Neeraj Kharpate, Ferran Garcia Pagans, Henric Cronström (0)
Weryfikacja opinii następuję na podstawie historii zamówień na koncie Użytkownika umieszczającego opinię. Użytkownik mógł otrzymać punkty za opublikowanie opinii uprawniające do uzyskania rabatu w ramach Programu Punktowego.