×
Dodano do koszyka:
Pozycja znajduje się w koszyku, zwiększono ilość tej pozycji:
Zakupiłeś już tę pozycję:
Książkę możesz pobrać z biblioteki w panelu użytkownika
Pozycja znajduje się w koszyku
Przejdź do koszyka

Zawartość koszyka

ODBIERZ TWÓJ BONUS :: »

Python Data Visualization Cookbook. Visualize data using Python's most popular libraries Dimitry Foures, Giuseppe Vettigli, Tarek Amr, Igor Milovanovic
(ebook) (audiobook) (audiobook) Książka w języku 1
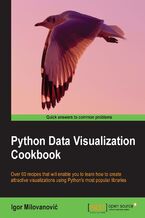
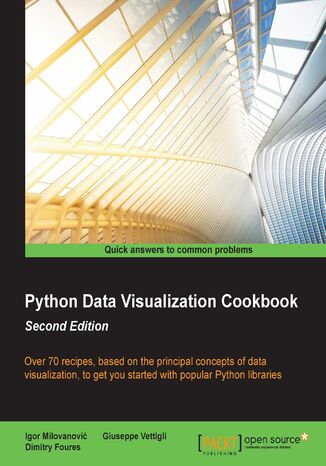
Python Data Visualization Cookbook. Visualize data using Python's most popular libraries Dimitry Foures, Giuseppe Vettigli, Tarek Amr, Igor Milovanovic - okladka książki

Python Data Visualization Cookbook. Visualize data using Python's most popular libraries Dimitry Foures, Giuseppe Vettigli, Tarek Amr, Igor Milovanovic - okladka książki

Python Data Visualization Cookbook. Visualize data using Python's most popular libraries Dimitry Foures, Giuseppe Vettigli, Tarek Amr, Igor Milovanovic - audiobook MP3

Python Data Visualization Cookbook. Visualize data using Python's most popular libraries Dimitry Foures, Giuseppe Vettigli, Tarek Amr, Igor Milovanovic - audiobook CD

Autorzy:
Dimitry Foures, Giuseppe Vettigli, Tarek Amr, Igor Milovanovic
Ocena:
Bądź pierwszym, który oceni tę książkę
Stron:
302
Dostępne formaty:
     PDF
     ePub
     Mobi
Python Data Visualization Cookbook will progress the reader from the point of installing and setting up a Python environment for data manipulation and visualization all the way to 3D animations using Python libraries. Readers will benefit from over 60 precise and reproducible recipes that will guide the reader towards a better understanding of data concepts and the building blocks for subsequent and sometimes more advanced concepts.

Python Data Visualization Cookbook starts by showing how to set up matplotlib and the related libraries that are required for most parts of the book, before moving on to discuss some of the lesser-used diagrams and charts such as Gantt Charts or Sankey diagrams. Initially it uses simple plots and charts to more advanced ones, to make it easy to understand for readers. As the readers will go through the book, they will get to know about the 3D diagrams and animations. Maps are irreplaceable for displaying geo-spatial data, so this book will also show how to build them. In the last chapter, it includes explanation on how to incorporate matplotlib into different environments, such as a writing system, LaTeX, or how to create Gantt charts using Python.

Wybrane bestsellery

O autorach książki

Dimitry is a data scientist with a background in applied mathematics and theoretical physics. After completing his physics undergraduate studies in ENS Lyon (France), he studied fluid mechanics at cole Polytechnique in Paris where he obtained first Class class Masters degree. He holds a PhD in applied mathematics from the University of Cambridge. He currently works as a data-scientist for a smart-energy start-up in Cambridge, in close collaboration with the university.
Giuseppe Vettigli is a data scientist who has worked in the research industry and academia for many years. His work is focused on the development of machine learning models and applications to use information from structured and unstructured data. He also writes about scientific computing and data visualisation in Python on his blog at https://glowingpython.blogspot.com.
Tarek Amr has 8 years of experience in data science and machine learning. After finishing his postgraduate degree at the University of East Anglia, he worked in a number of startups and scale-up companies in Egypt and the Netherlands. This is his second data-related book. His previous book covered data visualization using D3.js. He enjoys giving talks and writing about different computer science and business concepts and explaining them to a wider audience. He can be reached on Twitter at @gr33ndata. He is happy to respond to all questions related to this book. Feel free to get in touch with him if any parts of the book need clarification or if you would like to discuss any of the concepts here in more detail.
Igor Milovanović is an experienced developer, with strong background in Linux system knowledge and software engineering education. He is skilled in building scalable data-driven distributed software rich systems. An evangelist for high-quality systems design, he has a strong interest in software architecture and development methodologies. Igor is always committed to advocating methodologies that promote high-quality software, such as test-driven development, one-step builds, and continuous integration. He also possesses solid knowledge of product development. With field experience and official training, he is capable of transferring knowledge and communication flow from business to developers and vice versa. Igor is most grateful to his girlfriend for letting him spend hours on work instead with her and being an avid listener to his endless book monologues. He thanks his brother for being the strongest supporter. He is also thankful to his parents for letting him develop in various ways to become a person he is today.

Packt Publishing - inne książki

Zamknij

Przenieś na półkę

Proszę czekać...
ajax-loader

Zamknij

Wybierz metodę płatności

Ebook
125,10 zł
Dodaj do koszyka
Zamknij Pobierz aplikację mobilną Ebookpoint
Zabrania się wykorzystania treści strony do celów eksploracji tekstu i danych (TDM), w tym eksploracji w celu szkolenia technologii AI i innych systemów uczenia maszynowego. It is forbidden to use the content of the site for text and data mining (TDM), including mining for training AI technologies and other machine learning systems.