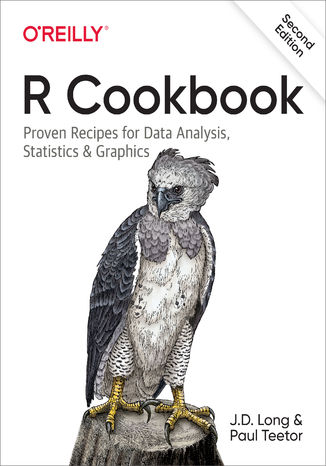
R Cookbook. Proven Recipes for Data Analysis, Statistics, and Graphics. 2nd Edition

- Autorzy:
- JD Long, Paul Teetor
- Promocja Przejdź


- Ocena:
- Bądź pierwszym, który oceni tę książkę
- Stron:
- 600
- Dostępne formaty:
-
ePubMobi
Opis książki: R Cookbook. Proven Recipes for Data Analysis, Statistics, and Graphics. 2nd Edition
Perform data analysis with R quickly and efficiently with more than 275 practical recipes in this expanded second edition. The R language provides everything you need to do statistical work, but its structure can be difficult to master. These task-oriented recipes make you productive with R immediately. Solutions range from basic tasks to input and output, general statistics, graphics, and linear regression.
Each recipe addresses a specific problem and includes a discussion that explains the solution and provides insight into how it works. If you’re a beginner, R Cookbook will help get you started. If you’re an intermediate user, this book will jog your memory and expand your horizons. You’ll get the job done faster and learn more about R in the process.
- Create vectors, handle variables, and perform basic functions
- Simplify data input and output
- Tackle data structures such as matrices, lists, factors, and data frames
- Work with probability, probability distributions, and random variables
- Calculate statistics and confidence intervals and perform statistical tests
- Create a variety of graphic displays
- Build statistical models with linear regressions and analysis of variance (ANOVA)
- Explore advanced statistical techniques, such as finding clusters in your data
Wybrane bestsellery
-
Oto zbiór 275 receptur instruktażowych, z których każda pomaga w rozwiązaniu konkretnego problemu. Wszystkie zostały starannie przetestowane i wielokrotnie dowodziły swojej przydatności. Każda z omawianych receptur została poprzedzona krótkim wprowadzeniem i omówieniem zastosowanych mechanizmów d...
Język R. Receptury. Analiza danych, statystyka i przetwarzanie grafiki. Wydanie II Język R. Receptury. Analiza danych, statystyka i przetwarzanie grafiki. Wydanie II
(0,00 zł najniższa cena z 30 dni)62.30 zł
89.00 zł(-30%) -
R is a powerful tool for statistics and graphics, but getting started with this language can be frustrating. This short, concise book provides beginners with a selection of how-to recipes to solve simple problems with R. Each solution gives you just what you need to know to use R for basic statis...
25 Recipes for Getting Started with R. Excerpts from the R Cookbook 25 Recipes for Getting Started with R. Excerpts from the R Cookbook
(0,00 zł najniższa cena z 30 dni)59.42 zł
69.90 zł(-15%) -
Dzięki tej książce nauczysz się przekształcać suche dane liczbowe w pełną empatii narrację! Aby spełniły one swoje zadanie, ktoś musi przedstawić zawarte w nich informacje w postaci opowieści. W tej publikacji wyczerpująco i praktycznie opisano przebieg tego procesu. Jej lektura sprawi, że rozwin...
Opowieści ukryte w danych. Wyjaśnij dane i wywołaj działania za pomocą narracji Opowieści ukryte w danych. Wyjaśnij dane i wywołaj działania za pomocą narracji
(0,00 zł najniższa cena z 30 dni)20.90 zł
67.00 zł(-69%) -
Metody statystyczne są kluczowym elementem data science, mimo to niewielu specjalistów data science posiada formalne wykształcenie statystyczne. Kursy i podręczniki o podstawach statystyki, rzadko kiedy omawiają temat z perspektywy data science. W drugim wydaniu tego popularnego podręcznika zosta...
Statystyka praktyczna w data science. 50 kluczowych zagadnień w językach R i Python. Wydanie II Statystyka praktyczna w data science. 50 kluczowych zagadnień w językach R i Python. Wydanie II
(0,00 zł najniższa cena z 30 dni)48.30 zł
69.00 zł(-30%) -
BPMN pozwala na ciągłe analizowanie, monitorowanie i optymalizowanie procesów biznesowych. Jest narzędziem bardzo skutecznym, prawdziwym „świętym Graalem” współczesnego biznesu. Jednak nie jest on niestety tak przyjazny, jak mógłby oczekiwać początkujący użytkownik. Jego oryginalną sp...
Zrozumieć BPMN. Modelowanie procesów biznesowych. Wydanie 2 rozszerzone Zrozumieć BPMN. Modelowanie procesów biznesowych. Wydanie 2 rozszerzone
(0,00 zł najniższa cena z 30 dni)34.30 zł
49.00 zł(-30%) -
Ta książka jest przewodnikiem dla każdego, kto musi przekazywać informacje, robiąc przy tym użytek z danych. Szczególnie wartościowa będzie dla analityków, studentów i naukowców, a także dla każdego, kto w swojej komunikacji odwołuje się do danych. Pokazano tu prostą i intuicyjną technikę przedst...
Storytelling danych. Poradnik wizualizacji danych dla profesjonalistów Storytelling danych. Poradnik wizualizacji danych dla profesjonalistów
(0,00 zł najniższa cena z 30 dni)53.90 zł
77.00 zł(-30%) -
To drugie, w pełni zaktualizowane wydanie znakomitego przewodnika, dzięki któremu bezproblemowo rozpoczniesz pracę z Power BI i w pełni wykorzystasz jego możliwości. Dowiesz się, jak pozyskiwać i oczyszczać dane z różnych źródeł, a także jak zaprojektować model danych, aby móc analizować relacje ...
Microsoft Power BI. Jak modelować i wizualizować dane oraz budować narracje cyfrowe. Wydanie II Microsoft Power BI. Jak modelować i wizualizować dane oraz budować narracje cyfrowe. Wydanie II
Devin Knight, Mitchell Pearson, Bradley Schacht, Erin Ostrowsky
(0,00 zł najniższa cena z 30 dni)53.90 zł
77.00 zł(-30%) -
Termin business intelligence ostatnimi czasy jest odmieniany przez wszystkie przypadki. Według raportu Gartnera z 2020 roku aktualnie liderem w dziedzinie narzędzi BI jest Microsoft - ten kurs video oferuje możliwość zapoznania się z jednym z nich. Power BI, bo o nim mowa, pozwala efektywnie anal...
Power BI Desktop. Kurs video. Wykorzystanie narzędzia w analizie i wizualizacji danych Power BI Desktop. Kurs video. Wykorzystanie narzędzia w analizie i wizualizacji danych
(0,00 zł najniższa cena z 30 dni)194.35 zł
299.00 zł(-35%) -
Data is at the center of many challenges in system design today. Difficult issues need to be figured out, such as scalability, consistency, reliability, efficiency, and maintainability. In addition, we have an overwhelming variety of tools, including relational databases, NoSQL datastores, stream...
Designing Data-Intensive Applications. The Big Ideas Behind Reliable, Scalable, and Maintainable Systems Designing Data-Intensive Applications. The Big Ideas Behind Reliable, Scalable, and Maintainable Systems
(0,00 zł najniższa cena z 30 dni)203.15 zł
239.00 zł(-15%) -
W tym przewodniku opisano zagadnienia związane z podstawami nauki o danych. Wyjaśniono niezbędne elementy matematyki i statystyki. Przedstawiono także techniki budowy potrzebnych narzędzi i sposoby działania najistotniejszych algorytmów. Książka została skonstruowana tak, aby poszczególne impleme...
Data science od podstaw. Analiza danych w Pythonie. Wydanie II Data science od podstaw. Analiza danych w Pythonie. Wydanie II
(0,00 zł najniższa cena z 30 dni)55.30 zł
79.00 zł(-30%)
O autorach książki
2 JD Long, Paul TeetorJ.D. Long - jest programistą i założycielem stowarzyszenia Chicago R User Group. Pasjonuje go tworzenie kodu w językach Python i R oraz usługi AWS. Jest znany z obrazowych metafor, którymi okrasza swoje wystąpienia na konferencjach poświęconych językowi R.
Paul Teetor jest programistą statystycznym. Specjalizuje się w analizie i inżynierii oprogramowania w sektorach zarządzania inwestycyjnego, handlu papierami wartościowymi i zarządzania ryzykiem. Współpracuje z funduszami hedgingowymi, maklerami i zarządcami portfeli na terenie Chicago.
Kup polskie wydanie:
Język R. Receptury. Analiza danych, statystyka i przetwarzanie grafiki. Wydanie II
- Autor:
- JD Long, Paul Teetor
62,30 zł
89,00 zł
(53.40 zł najniższa cena z 30 dni)
Ebooka przeczytasz na:
-
czytnikach Inkbook, Kindle, Pocketbook i innych
-
systemach Windows, MacOS i innych
-
systemach Windows, Android, iOS, HarmonyOS
-
na dowolnych urządzeniach i aplikacjach obsługujących formaty: PDF, EPub, Mobi
Masz pytania? Zajrzyj do zakładki Pomoc »
Audiobooka posłuchasz:
-
w aplikacji Ebookpoint na Android, iOS, HarmonyOs
-
na systemach Windows, MacOS i innych
-
na dowolonych urządzeniach i aplikacjach obsługujących format MP3 (pliki spakowane w ZIP)
Masz pytania? Zajrzyj do zakładki Pomoc »
Kurs Video zobaczysz:
-
w aplikacji Ebookpoint na Android, iOS, HarmonyOs
-
na systemach Windows, MacOS i innych
-
na dowolonych urządzeniach i aplikacjach obsługujących format MP4 (pliki spakowane w ZIP)
Szczegóły książki
- ISBN Ebooka:
- 978-14-920-4063-7, 9781492040637
- Data wydania ebooka:
-
2019-06-21
Data wydania ebooka często jest dniem wprowadzenia tytułu do sprzedaży i może nie być równoznaczna z datą wydania książki papierowej. Dodatkowe informacje możesz znaleźć w darmowym fragmencie. Jeśli masz wątpliwości skontaktuj się z nami sklep@helion.pl.
- Język publikacji:
- angielski
- Rozmiar pliku ePub:
- 9.4MB
- Rozmiar pliku Mobi:
- 9.4MB
- Kategorie:
Big Data » Analiza danych
Spis treści książki
- Welcome to the R Cookbook, 2nd Edition
- The Recipes
- A Note on Terminology
- Software and Platform Notes
- Other Resources
- Conventions Used in This Book
- Using Code Examples
- OReilly Online Learning
- How to Contact Us
- Acknowledgments
- 1. Getting Started and Getting Help
- Downloading and Installing R
- Problem
- Solution
- Windows
- macOS
- Linux or Unix
- Discussion
- See Also
- Downloading and Installing R
- Installing RStudio
- Problem
- Solution
- Discussion
- Starting RStudio
- Problem
- Solution
- Discussion
- Entering Commands
- Problem
- Solution
- Discussion
- See Also
- Exiting from RStudio
- Problem
- Solution
- Windows and most Linux distributions
- macOS
- Discussion
- See Also
- Interrupting R
- Problem
- Solution
- Discussion
- See Also
- Viewing the Supplied Documentation
- Problem
- Solution
- Discussion
- See Also
- Getting Help on a Function
- Problem
- Solution
- Discussion
- See Also
- Searching the Supplied Documentation
- Problem
- Solution
- Discussion
- See Also
- Getting Help on a Package
- Problem
- Solution
- Discussion
- See Also
- Searching the Web for Help
- Problem
- Solution
- Discussion
- See Also
- Finding Relevant Functions and Packages
- Problem
- Solution
- Discussion
- See Also
- Searching the Mailing Lists
- Problem
- Solution
- Discussion
- See Also
- Submitting Questions to Stack Overflow or Elsewhere in the Community
- Problem
- Solution
- Discussion
- See Also
- 2. Some Basics
- Printing Something to the Screen
- Problem
- Solution
- Discussion
- See Also
- Printing Something to the Screen
- Setting Variables
- Problem
- Solution
- Discussion
- See Also
- Listing Variables
- Problem
- Solution
- Discussion
- See Also
- Deleting Variables
- Problem
- Solution
- Discussion
- See Also
- Creating a Vector
- Problem
- Solution
- Discussion
- See Also
- Computing Basic Statistics
- Problem
- Solution
- Discussion
- See Also
- Creating Sequences
- Problem
- Solution
- Discussion
- See Also
- Comparing Vectors
- Problem
- Solution
- Discussion
- See Also
- Selecting Vector Elements
- Problem
- Solution
- Discussion
- See Also
- Performing Vector Arithmetic
- Problem
- Solution
- Discussion
- See Also
- Getting Operator Precedence Right
- Problem
- Solution
- Discussion
- See Also
- Typing Less and Accomplishing More
- Problem
- Solution
- Discussion
- Creating a Pipeline of Function Calls
- Problem
- Solution
- Discussion
- Avoiding Some Common Mistakes
- Problem
- Discussion
- Forgetting the parentheses after a function invocation
- Mistyping <- as <(space)-
- Incorrectly continuing an expression across lines
- Using = instead of ==
- Writing 1:n+1 when you mean 1:(n+1)
- Getting bitten by the Recycling Rule
- Installing a package but not loading it with library or require
- Writing lst[n] when you mean lst[[n]] or vice versa
- Using & instead of &&, or vice versa; same for | and ||
- Passing multiple arguments to a single-argument function
- Thinking that max behaves like pmax, or that min behaves like pmin
- Misusing a function that does not understand data frames
- Using a single backslash (\) in Windows paths
- Posting a question to Stack Overflow or the mailing list before searching for the answer
- See Also
- 3. Navigating the Software
- Getting and Setting the Working Directory
- Problem
- Solution
- Discussion
- See Also
- Getting and Setting the Working Directory
- Creating a New RStudio Project
- Problem
- Solution
- Discussion
- Saving Your Workspace
- Problem
- Solution
- Discussion
- See Also
- Viewing Your Command History
- Problem
- Solution
- Discussion
- Saving the Result of the Previous Command
- Problem
- Solution
- Discussion
- See Also
- Displaying Loaded Packages via the Search Path
- Problem
- Solution
- Discussion
- See Also
- Viewing the List of Installed Packages
- Problem
- Solution
- Discussion
- See Also
- Accessing the Functions in a Package
- Problem
- Solution
- Discussion
- See Also
- Accessing Built-in Datasets
- Problem
- Solution
- Discussion
- See Also
- Installing Packages from CRAN
- Problem
- Solution
- Discussion
- See Also
- Installing a Package from GitHub
- Problem
- Solution
- Discussion
- Setting or Changing a Default CRAN Mirror
- Problem
- Solution
- Discussion
- See Also
- Running a Script
- Problem
- Solution
- Discussion
- See Also
- Running a Batch Script
- Problem
- Solution
- Discussion
- See Also
- Locating the R Home Directory
- Problem
- Solution
- Discussion
- Customizing R Startup
- Problem
- Solution
- Discussion
- Setting options
- Reproducibility
- Startup sequence
- See Also
- Using R and RStudio in the Cloud
- Problem
- Solution
- Discussion
- 4. Input and Output
- Entering Data from the Keyboard
- Problem
- Solution
- Discussion
- See Also
- Entering Data from the Keyboard
- Printing Fewer Digits (or More Digits)
- Problem
- Solution
- Discussion
- See Also
- Redirecting Output to a File
- Problem
- Solution
- Discussion
- Listing Files
- Problem
- Solution
- Discussion
- See Also
- Dealing with Cannot Open File in Windows
- Problem
- Solution
- Discussion
- Reading Fixed-Width Records
- Problem
- Solution
- Discussion
- See Also
- Reading Tabular Data Files
- Problem
- Solution
- Discussion
- See Also
- Reading from CSV Files
- Problem
- Solution
- Discussion
- See Also
- Writing to CSV Files
- Problem
- Solution
- Discussion
- See Also
- Reading Tabular or CSV Data from the Web
- Problem
- Solution
- Discussion
- See Also
- Reading Data from Excel
- Problem
- Solution
- Discussion
- See Also
- Writing a Data Frame to Excel
- Problem
- Solution
- Discussion
- See Also
- Reading Data from a SAS File
- Problem
- Solution
- Discussion
- See Also
- Reading Data from HTML Tables
- Problem
- Solution
- Discussion
- See Also
- Reading Files with a Complex Structure
- Problem
- Solution
- Discussion
- An Example
- Reading from MySQL Databases
- Problem
- Solution
- Discussion
- See Also
- Accessing a Database with dbplyr
- Problem
- Solution
- Discussion
- See Also
- Saving and Transporting Objects
- Problem
- Solution
- Discussion
- See Also
- 5. Data Structures
- Vectors
- Lists
- Mode: Physical Type
- Class: Abstract Type
- Scalars
- Matrices
- Arrays
- Factors
- Data Frames
- Tibbles
- Appending Data to a Vector
- Problem
- Solution
- Discussion
- Inserting Data into a Vector
- Problem
- Solution
- Discussion
- Understanding the Recycling Rule
- Problem
- Discussion
- Creating a Factor (Categorical Variable)
- Problem
- Solution
- Discussion
- See Also
- Combining Multiple Vectors into One Vector and a Factor
- Problem
- Solution
- Discussion
- Creating a List
- Problem
- Solution
- Discussion
- See Also
- Selecting List Elements by Position
- Problem
- Solution
- Discussion
- Selecting List Elements by Name
- Problem
- Solution
- Discussion
- See Also
- Building a Name/Value Association List
- Problem
- Solution
- Discussion
- Removing an Element from a List
- Problem
- Solution
- Discussion
- Flattening a List into a Vector
- Problem
- Solution
- Discussion
- See Also
- Removing NULL Elements from a List
- Problem
- Solution
- Discussion
- See Also
- Removing List Elements Using a Condition
- Problem
- Solution
- Discussion
- See Also
- Initializing a Matrix
- Problem
- Solution
- Discussion
- See Also
- Performing Matrix Operations
- Problem
- Solution
- Discussion
- Giving Descriptive Names to the Rows and Columns of a Matrix
- Problem
- Solution
- Discussion
- Selecting One Row or Column from a Matrix
- Problem
- Solution
- Discussion
- Initializing a Data Frame from Column Data
- Problem
- Solution
- Discussion
- Factors in data frames
- Initializing a Data Frame from Row Data
- Problem
- Solution
- Discussion
- Factors in data frames
- See Also
- Appending Rows to a Data Frame
- Problem
- Solution
- Discussion
- Selecting Data Frame Columns by Position
- Problem
- Solution
- Discussion
- List expressions
- Matrix-style subscripting
- See Also
- Selecting Data Frame Columns by Name
- Problem
- Solution
- Discussion
- List expressions
- Matrix-style subscripting
- See Also
- Changing the Names of Data Frame Columns
- Problem
- Solution
- Discussion
- See Also
- Removing NAs from a Data Frame
- Problem
- Solution
- Discussion
- Excluding Columns by Name
- Problem
- Solution
- Discussion
- Combining Two Data Frames
- Problem
- Solution
- Discussion
- Merging Data Frames by Common Column
- Problem
- Solution
- Discussion
- See Also
- Converting One Atomic Value into Another
- Problem
- Solution
- Discussion
- Converting One Structured Data Type into Another
- Problem
- Solution
- Discussion
- Special considerations for matrices
- See Also
- 6. Data Transformations
- Applying a Function to Each List Element
- Problem
- Solution
- Discussion
- See Also
- Applying a Function to Each List Element
- Applying a Function to Every Row of a Data Frame
- Problem
- Solution
- Discussion
- Applying a Function to Every Row of a Matrix
- Problem
- Solution
- Discussion
- Applying a Function to Every Column
- Problem
- Solution
- Discussion
- See Also
- Applying a Function to Parallel Vectors or Lists
- Problem
- Solution
- Discussion
- See Also
- Applying a Function to Groups of Data
- Problem
- Solution
- Discussion
- Creating a New Column Based on Some Condition
- Problem
- Solution
- Discussion
- See Also
- 7. Strings and Dates
- Classes for Dates and Times
- See Also
- Getting the Length of a String
- Problem
- Solution
- Discussion
- Concatenating Strings
- Problem
- Solution
- Discussion
- Extracting Substrings
- Problem
- Solution
- Discussion
- Splitting a String According to a Delimiter
- Problem
- Solution
- Discussion
- See Also
- Replacing Substrings
- Problem
- Solution
- Discussion
- See Also
- Generating All Pairwise Combinations of Strings
- Problem
- Solution
- Discussion
- See Also
- Getting the Current Date
- Problem
- Solution
- Discussion
- See Also
- Converting a String into a Date
- Problem
- Solution
- Discussion
- Converting a Date into a String
- Problem
- Solution
- Discussion
- Converting Year, Month, and Day into a Date
- Problem
- Solution
- Discussion
- Getting the Julian Date
- Problem
- Solution
- Discussion
- Extracting the Parts of a Date
- Problem
- Solution
- Discussion
- Creating a Sequence of Dates
- Problem
- Solution
- Discussion
- 8. Probability
- Names of Distributions
- Getting Help on Probability Distributions
- See Also
- Counting the Number of Combinations
- Problem
- Solution
- Discussion
- See Also
- Generating Combinations
- Problem
- Solution
- Discussion
- See Also
- Generating Random Numbers
- Problem
- Solution
- Discussion
- See Also
- Generating Reproducible Random Numbers
- Problem
- Solution
- Discussion
- See Also
- Generating a Random Sample
- Problem
- Solution
- Discussion
- See Also
- Generating Random Sequences
- Problem
- Solution
- Discussion
- Randomly Permuting a Vector
- Problem
- Solution
- Discussion
- See Also
- Calculating Probabilities for Discrete Distributions
- Problem
- Solution
- Discussion
- See Also
- Calculating Probabilities for Continuous Distributions
- Problem
- Solution
- Discussion
- See Also
- Converting Probabilities to Quantiles
- Problem
- Solution
- Discussion
- See Also
- Plotting a Density Function
- Problem
- Solution
- Discussion
- 9. General Statistics
- Null Hypotheses, Alternative Hypotheses, and p-Values
- Confidence Intervals
- See Also
- Summarizing Your Data
- Problem
- Solution
- Discussion
- See Also
- Calculating Relative Frequencies
- Problem
- Solution
- Discussion
- Tabulating Factors and Creating Contingency Tables
- Problem
- Solution
- Discussion
- See Also
- Testing Categorical Variables for Independence
- Problem
- Solution
- Discussion
- See Also
- Calculating Quantiles (and Quartiles) of a Dataset
- Problem
- Solution
- Discussion
- Inverting a Quantile
- Problem
- Solution
- Discussion
- See Also
- Converting Data to z-Scores
- Problem
- Solution
- Discussion
- Testing the Mean of a Sample (t-Test)
- Problem
- Solution
- Discussion
- See Also
- Forming a Confidence Interval for a Mean
- Problem
- Solution
- Discussion
- Forming a Confidence Interval for a Median
- Problem
- Solution
- Discussion
- See Also
- Testing a Sample Proportion
- Problem
- Solution
- Discussion
- Forming a Confidence Interval for a Proportion
- Problem
- Solution
- Discussion
- See Also
- Testing for Normality
- Problem
- Solution
- Discussion
- See Also
- Testing for Runs
- Problem
- Solution
- Discussion
- See Also
- Comparing the Means of Two Samples
- Problem
- Solution
- Discussion
- See Also
- Comparing the Locations of Two Samples Nonparametrically
- Problem
- Solution
- Discussion
- See Also
- Testing a Correlation for Significance
- Problem
- Solution
- Discussion
- See Also
- Testing Groups for Equal Proportions
- Problem
- Solution
- Discussion
- See Also
- Performing Pairwise Comparisons Between Group Means
- Problem
- Solution
- Discussion
- See Also
- Testing Two Samples for the Same Distribution
- Problem
- Solution
- Discussion
- 10. Graphics
- The Illustrations
- Notes on ggplot2 Basics
- Long Versus Wide Data with ggplot
- Graphics in Other Packages
- Creating a Scatter Plot
- Problem
- Solution
- Discussion
- See Also
- Adding a Title and Labels
- Problem
- Solution
- Discussion
- Adding (or Removing) a Grid
- Problem
- Solution
- Discussion
- See Also
- Applying a Theme to a ggplot Figure
- Problem
- Solution
- Discussion
- See Also
- Creating a Scatter Plot of Multiple Groups
- Problem
- Solution
- Discussion
- See Also
- Adding (or Removing) a Legend
- Problem
- Solution
- Discussion
- Plotting the Regression Line of a Scatter Plot
- Problem
- Solution
- Discussion
- See Also
- Plotting All Variables Against All Other Variables
- Problem
- Solution
- Discussion
- Creating One Scatter Plot for Each Group
- Problem
- Solution
- Discussion
- See Also
- Creating a Bar Chart
- Problem
- Solution
- Discussion
- See Also
- Adding Confidence Intervals to a Bar Chart
- Problem
- Solution
- Discussion
- See Also
- Coloring a Bar Chart
- Problem
- Solution
- Discussion
- See Also
- Plotting a Line from x and y Points
- Problem
- Solution
- Discussion
- See Also
- Changing the Type, Width, or Color of a Line
- Problem
- Solution
- Discussion
- See Also
- Plotting Multiple Datasets
- Problem
- Solution
- Discussion
- Adding Vertical or Horizontal Lines
- Problem
- Solution
- Discussion
- See Also
- Creating a Boxplot
- Problem
- Solution
- Discussion
- See Also
- Creating One Boxplot for Each Factor Level
- Problem
- Solution
- Discussion
- See Also
- Creating a Histogram
- Problem
- Solution
- Discussion
- See Also
- Adding a Density Estimate to a Histogram
- Problem
- Solution
- Discussion
- See Also
- Creating a Normal QuantileQuantile Plot
- Problem
- Solution
- Discussion
- See Also
- Creating Other QuantileQuantile Plots
- Problem
- Solution
- Discussion
- Plotting a Variable in Multiple Colors
- Problem
- Solution
- Discussion
- See Also
- Graphing a Function
- Problem
- Solution
- Discussion
- See Also
- Displaying Several Figures on One Page
- Problem
- Solution
- Discussion
- See Also
- Writing Your Plot to a File
- Problem
- Solution
- Discussion
- See Also
- 11. Linear Regression and ANOVA
- ANOVA
- Example Data
- See Also
- Performing Simple Linear Regression
- Problem
- Solution
- Discussion
- Performing Multiple Linear Regression
- Problem
- Solution
- Discussion
- See Also
- Getting Regression Statistics
- Problem
- Solution
- Discussion
- See Also
- Understanding the Regression Summary
- Problem
- Discussion
- See Also
- Performing Linear Regression Without an Intercept
- Problem
- Solution
- Discussion
- Regressing Only Variables That Highly Correlate with Your Dependent Variable
- Problem
- Solution
- Discussion
- Performing Linear Regression with Interaction Terms
- Problem
- Solution
- Discussion
- See Also
- Selecting the Best Regression Variables
- Problem
- Solution
- Discussion
- See Also
- Regressing on a Subset of Your Data
- Problem
- Solution
- Discussion
- Using an Expression Inside a Regression Formula
- Problem
- Solution
- Discussion
- See Also
- Regressing on a Polynomial
- Problem
- Solution
- Discussion
- See Also
- Regressing on Transformed Data
- Problem
- Solution
- Discussion
- See Also
- Finding the Best Power Transformation (BoxCox Procedure)
- Problem
- Solution
- Discussion
- See Also
- Forming Confidence Intervals for Regression Coefficients
- Problem
- Solution
- Discussion
- See Also
- Plotting Regression Residuals
- Problem
- Solution
- Discussion
- See Also
- Diagnosing a Linear Regression
- Problem
- Solution
- Discussion
- See Also
- Identifying Influential Observations
- Problem
- Solution
- Discussion
- See Also
- Testing Residuals for Autocorrelation (DurbinWatson Test)
- Problem
- Solution
- Discussion
- See Also
- Predicting New Values
- Problem
- Solution
- Discussion
- See Also
- Forming Prediction Intervals
- Problem
- Solution
- Discussion
- Performing One-Way ANOVA
- Problem
- Solution
- Discussion
- See Also
- Creating an Interaction Plot
- Problem
- Solution
- Discussion
- See Also
- Finding Differences Between Means of Groups
- Problem
- Solution
- Discussion
- See Also
- Performing Robust ANOVA (KruskalWallis Test)
- Problem
- Solution
- Discussion
- Comparing Models by Using ANOVA
- Problem
- Solution
- Discussion
- 12. Useful Tricks
- Peeking at Your Data
- Problem
- Solution
- Discussion
- See Also
- Peeking at Your Data
- Printing the Result of an Assignment
- Problem
- Solution
- Discussion
- See Also
- Summing Rows and Columns
- Problem
- Solution
- Discussion
- Printing Data in Columns
- Problem
- Solution
- Discussion
- Binning Your Data
- Problem
- Solution
- Discussion
- Finding the Position of a Particular Value
- Problem
- Solution
- Discussion
- See Also
- Selecting Every nth Element of a Vector
- Problem
- Solution
- Discussion
- See Also
- Finding Minimums or Maximums
- Problem
- Solution
- Discussion
- See Also
- Generating All Combinations of Several Variables
- Problem
- Solution
- Discussion
- See Also
- Flattening a Data Frame
- Problem
- Solution
- Discussion
- See Also
- Sorting a Data Frame
- Problem
- Solution
- Discussion
- Stripping Attributes from a Variable
- Problem
- Solution
- Discussion
- See Also
- Revealing the Structure of an Object
- Problem
- Solution
- Discussion
- Timing Your Code
- Problem
- Solution
- Discussion
- Suppressing Warnings and Error Messages
- Problem
- Solution
- Discussion
- See Also
- Taking Function Arguments from a List
- Problem
- Solution
- Discussion
- See Also
- Defining Your Own Binary Operators
- Problem
- Solution
- Discussion
- See Also
- Suppressing the Startup Message
- Problem
- Solution
- Discussion
- Getting and Setting Environment Variables
- Problem
- Solution
- Discussion
- See Also
- Use Code Sections
- Problem
- Solution
- Discussion
- See Also
- Executing R in Parallel Locally
- Problem
- Solution
- Discussion
- See Also
- Executing R in Parallel Remotely
- Problem
- Solution
- Discussion
- See Also
- 13. Beyond Basic Numerics and Statistics
- Minimizing or Maximizing a Single-Parameter Function
- Problem
- Solution
- Discussion
- See Also
- Minimizing or Maximizing a Single-Parameter Function
- Minimizing or Maximizing a Multiparameter Function
- Problem
- Solution
- Discussion
- See Also
- Calculating Eigenvalues and Eigenvectors
- Problem
- Solution
- Discussion
- Performing Principal Component Analysis
- Problem
- Solution
- Discussion
- See Also
- Performing Simple Orthogonal Regression
- Problem
- Solution
- Discussion
- See Also
- Finding Clusters in Your Data
- Problem
- Solution
- Discussion
- See Also
- Predicting a Binary-Valued Variable (Logistic Regression)
- Problem
- Solution
- Discussion
- See Also
- Bootstrapping a Statistic
- Problem
- Solution
- Discussion
- See Also
- Factor Analysis
- Problem
- Solution
- Discussion
- See Also
- 14. Time Series Analysis
- Other Representations
- ts (base distribution)
- tsibble package
- Other Representations
- Date Versus Datetime
- See Also
- Representing Time Series Data
- Problem
- Solution
- Discussion
- See Also
- Plotting Time Series Data
- Problem
- Solution
- Discussion
- See Also
- Extracting the Oldest or Newest Observations
- Problem
- Solution
- Discussion
- See Also
- Subsetting a Time Series
- Problem
- Solution
- Discussion
- See Also
- Merging Several Time Series
- Problem
- Solution
- Discussion
- Filling or Padding a Time Series
- Problem
- Solution
- Discussion
- Lagging a Time Series
- Problem
- Solution
- Discussion
- Computing Successive Differences
- Problem
- Solution
- Discussion
- Performing Calculations on Time Series
- Problem
- Solution
- Discussion
- See Also
- Computing a Moving Average
- Problem
- Solution
- Discussion
- See Also
- Applying a Function by Calendar Period
- Problem
- Solution
- Discussion
- Applying a Rolling Function
- Problem
- Solution
- Discussion
- Plotting the Autocorrelation Function
- Problem
- Solution
- Discussion
- Testing a Time Series for Autocorrelation
- Problem
- Solution
- Discussion
- See Also
- Plotting the Partial Autocorrelation Function
- Problem
- Solution
- Discussion
- See Also
- Finding Lagged Correlations Between Two Time Series
- Problem
- Solution
- Discussion
- Detrending a Time Series
- Problem
- Solution
- Discussion
- Fitting an ARIMA Model
- Problem
- Solution
- Discussion
- See Also
- Removing Insignificant ARIMA Coefficients
- Problem
- Solution
- Discussion
- Running Diagnostics on an ARIMA Model
- Problem
- Solution
- Discussion
- Making Forecasts from an ARIMA Model
- Problem
- Solution
- Discussion
- Plotting a Forecast
- Problem
- Solution
- Discussion
- See Also
- Testing for Mean Reversion
- Problem
- Solution
- Discussion
- See Also
- Smoothing a Time Series
- Problem
- Solution
- Discussion
- See Also
- 15. Simple Programming
- Choosing Between Two Alternatives: if/else
- Problem
- Solution
- Discussion
- See Also
- Choosing Between Two Alternatives: if/else
- Iterating with a Loop
- Problem
- Solution
- Discussion
- See Also
- Defining a Function
- Problem
- Solution
- Discussion
- See Also
- Creating a Local Variable
- Problem
- Solution
- Discussion
- Choosing Between Multiple Alternatives: switch
- Problem
- Solution
- Discussion
- See Also
- Defining Defaults for Function Parameters
- Problem
- Solution
- Discussion
- Signaling Errors
- Problem
- Solution
- Discussion
- See Also
- Protecting Against Errors
- Problem
- Solution
- Discussion
- See Also
- Creating an Anonymous Function
- Problem
- Solution
- Discussion
- See Also
- Creating a Collection of Reusable Functions
- Problem
- Solution
- Discussion
- See Also
- Automatically Reindenting Code
- Problem
- Solution
- Discussion
- See Also
- 16. R Markdown and Publishing
- Creating a New Document
- Problem
- Solution
- Discussion
- Creating a New Document
- Adding a Title, Author, or Date
- Problem
- Solution
- Discussion
- See Also
- Formatting Document Text
- Problem
- Solution
- See Also
- Inserting Document Headings
- Problem
- Solution
- Discussion
- Inserting a List
- Problem
- Solution
- Discussion
- See Also
- Showing Output from R Code
- Problem
- Solution
- Discussion
- See Also
- Controlling Which Code and Results Are Shown
- Problem
- Solution
- Discussion
- See Also
- Inserting a Plot
- Problem
- Solution
- Discussion
- Inserting a Table
- Problem
- Solution
- Discussion
- See Also
- Inserting a Table of Data
- Problem
- Solution
- Discussion
- Inserting Math Equations
- Problem
- Solution
- Discussion
- Generating HTML Output
- Problem
- Solution
- Discussion
- See Also
- Generating PDF Output
- Problem
- Solution
- Discussion
- See Also
- Generating Microsoft Word Output
- Problem
- Solution
- Discussion
- See Also
- Generating Presentation Output
- Problem
- Solution
- Discussion
- See Also
- Creating a Parameterized Report
- Problem
- Solution
- Discussion
- See Also
- Organizing Your R Markdown Workflow
- Problem
- Solution
- Use RStudio Projects
- Name directories intuitively
- Create an R package for reused logic
- Keep R Markdown focused on content, and source logic
- See Also
- Index
O'Reilly Media - inne książki
-
FinOps brings financial accountability to the variable spend model of cloud. Used by the majority of global enterprises, this management practice has grown from a fringe activity to the de facto discipline managing cloud spend. In this book, authors J.R. Storment and Mike Fuller outline the proce...(0,00 zł najniższa cena z 30 dni)
262.65 zł
309.00 zł(-15%) -
Edge AI is transforming the way computers interact with the real world, allowing IoT devices to make decisions using the 99% of sensor data that was previously discarded due to cost, bandwidth, or power limitations. With techniques like embedded machine learning, developers can capture human intu...(0,00 zł najniższa cena z 30 dni)
262.65 zł
309.00 zł(-15%) -
Why is it difficult for so many companies to get digital identity right? If you're still wrestling with even simple identity problems like modern website authentication, this practical book has the answers you need. Author Phil Windley provides conceptual frameworks to help you make sense of all ...(0,00 zł najniższa cena z 30 dni)
186.15 zł
219.00 zł(-15%) -
Python was recently ranked as today's most popular programming language on the TIOBE index, thanks to its broad applicability to design and prototyping to testing, deployment, and maintenance. With this updated fourth edition, you'll learn how to get the most out of Python, whether you're a profe...(0,00 zł najniższa cena z 30 dni)
296.65 zł
349.00 zł(-15%) -
With the accelerating speed of business and the increasing dependence on technology, companies today are significantly changing the way they build in-house business solutions. Many now use low-code and no code technologies to help them deal with specific issues, but that's just the beginning. Wit...
Building Solutions with the Microsoft Power Platform Building Solutions with the Microsoft Power Platform
(0,00 zł najniższa cena z 30 dni)262.65 zł
309.00 zł(-15%) -
Companies are scrambling to integrate AI into their systems and operations. But to build truly successful solutions, you need a firm grasp of the underlying mathematics. This accessible guide walks you through the math necessary to thrive in the AI field such as focusing on real-world application...(0,00 zł najniższa cena z 30 dni)
262.65 zł
309.00 zł(-15%) -
DevOps engineers, developers, and security engineers have ever-changing roles to play in today's cloud native world. In order to build secure and resilient applications, you have to be equipped with security knowledge. Enter security as code.In this book, authors BK Sarthak Das and Virginia Chu d...(0,00 zł najniższa cena z 30 dni)
186.15 zł
219.00 zł(-15%) -
With the increasing use of AI in high-stakes domains such as medicine, law, and defense, organizations spend a lot of time and money to make ML models trustworthy. Many books on the subject offer deep dives into theories and concepts. This guide provides a practical starting point to help develop...(0,00 zł najniższa cena z 30 dni)
262.65 zł
309.00 zł(-15%) -
Why are so many companies adopting GitOps for their DevOps and cloud native strategy? This reliable framework is quickly becoming the standard method for deploying apps to Kubernetes. With this practical, developer-oriented book, DevOps engineers, developers, IT architects, and SREs will learn th...(0,00 zł najniższa cena z 30 dni)
262.65 zł
309.00 zł(-15%) -
Learn the essentials of working with Flutter and Dart to build full stack applications that meet the needs of a cloud-driven world. Together, the Flutter open source UI software development kit and the Dart programming language for client development provide a unified solution to building applica...(0,00 zł najniższa cena z 30 dni)
220.15 zł
259.00 zł(-15%)
Dzieki opcji "Druk na żądanie" do sprzedaży wracają tytuły Grupy Helion, które cieszyły sie dużym zainteresowaniem, a których nakład został wyprzedany.
Dla naszych Czytelników wydrukowaliśmy dodatkową pulę egzemplarzy w technice druku cyfrowego.
Co powinieneś wiedzieć o usłudze "Druk na żądanie":
- usługa obejmuje tylko widoczną poniżej listę tytułów, którą na bieżąco aktualizujemy;
- cena książki może być wyższa od początkowej ceny detalicznej, co jest spowodowane kosztami druku cyfrowego (wyższymi niż koszty tradycyjnego druku offsetowego). Obowiązująca cena jest zawsze podawana na stronie WWW książki;
- zawartość książki wraz z dodatkami (płyta CD, DVD) odpowiada jej pierwotnemu wydaniu i jest w pełni komplementarna;
- usługa nie obejmuje książek w kolorze.
W przypadku usługi "Druk na żądanie" termin dostarczenia przesyłki może obejmować także czas potrzebny na dodruk (do 10 dni roboczych)
Masz pytanie o konkretny tytuł? Napisz do nas: sklep[at]helion.pl.
Książka, którą chcesz zamówić pochodzi z końcówki nakładu. Oznacza to, że mogą się pojawić drobne defekty (otarcia, rysy, zagięcia).
Co powinieneś wiedzieć o usłudze "Końcówka nakładu":
- usługa obejmuje tylko książki oznaczone tagiem "Końcówka nakładu";
- wady o których mowa powyżej nie podlegają reklamacji;
Masz pytanie o konkretny tytuł? Napisz do nas: sklep[at]helion.pl.


Oceny i opinie klientów: R Cookbook. Proven Recipes for Data Analysis, Statistics, and Graphics. 2nd Edition JD Long, Paul Teetor (0)
Weryfikacja opinii następuję na podstawie historii zamówień na koncie Użytkownika umieszczającego opinię. Użytkownik mógł otrzymać punkty za opublikowanie opinii uprawniające do uzyskania rabatu w ramach Programu Punktowego.