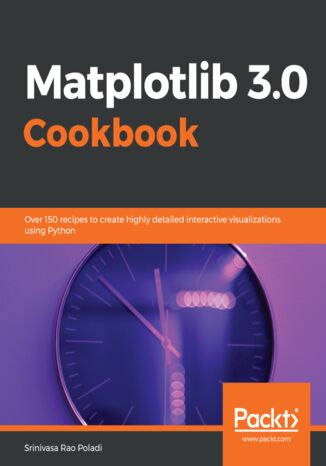
Matplotlib 3.0 Cookbook. Over 150 recipes to create highly detailed interactive visualizations using Python Srinivasa Rao Poladi


- Autor:
- Srinivasa Rao Poladi
- Wydawnictwo:
- Packt Publishing
- Ocena:
- Stron:
- 676
- Dostępne formaty:
-
PDFePubMobi
Opis
książki
:
Matplotlib 3.0 Cookbook. Over 150 recipes to create highly detailed interactive visualizations using Python
With the help of this cookbook, you'll be able to tackle any problem you might come across while designing attractive, insightful data visualizations. With the help of over 150 recipes, you'll learn how to develop plots related to business intelligence, data science, and engineering disciplines with highly detailed visualizations. Once you've familiarized yourself with the fundamentals, you'll move on to developing professional dashboards with a wide variety of graphs and sophisticated grid layouts in 2D and 3D. You'll annotate and add rich text to the plots, enabling the creation of a business storyline. In addition to this, you'll learn how to save figures and animations in various formats for downstream deployment, followed by extending the functionality offered by various internal and third-party toolkits, such as axisartist, axes_grid, Cartopy, and Seaborn.
By the end of this book, you'll be able to create high-quality customized plots and deploy them on the web and on supported GUI applications such as Tkinter, Qt 5, and wxPython by implementing real-world use cases and examples.
Wybrane bestsellery
Packt Publishing - inne książki
Dzięki opcji "Druk na żądanie" do sprzedaży wracają tytuły Grupy Helion, które cieszyły sie dużym zainteresowaniem, a których nakład został wyprzedany.
Dla naszych Czytelników wydrukowaliśmy dodatkową pulę egzemplarzy w technice druku cyfrowego.
Co powinieneś wiedzieć o usłudze "Druk na żądanie":
- usługa obejmuje tylko widoczną poniżej listę tytułów, którą na bieżąco aktualizujemy;
- cena książki może być wyższa od początkowej ceny detalicznej, co jest spowodowane kosztami druku cyfrowego (wyższymi niż koszty tradycyjnego druku offsetowego). Obowiązująca cena jest zawsze podawana na stronie WWW książki;
- zawartość książki wraz z dodatkami (płyta CD, DVD) odpowiada jej pierwotnemu wydaniu i jest w pełni komplementarna;
- usługa nie obejmuje książek w kolorze.
Masz pytanie o konkretny tytuł? Napisz do nas: sklep@helion.pl
Książka drukowana









Oceny i opinie klientów: Matplotlib 3.0 Cookbook. Over 150 recipes to create highly detailed interactive visualizations using Python Srinivasa Rao Poladi
(0)