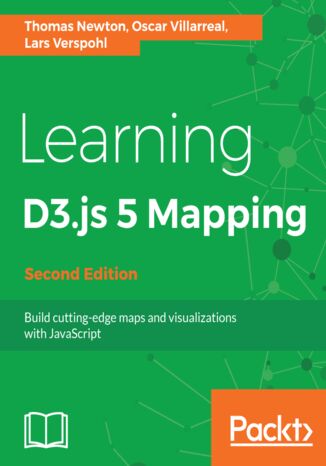
Learning D3.js 5 Mapping. Build cutting-edge maps and visualizations with JavaScript - Second Edition Thomas Newton, Oscar Villarreal, Lars Verspohl


- Autorzy:
- Thomas Newton, Oscar Villarreal, Lars Verspohl
- Wydawnictwo:
- Packt Publishing
- Ocena:
- Stron:
- 298
- Dostępne formaty:
-
PDFePubMobi
Opis
książki
:
Learning D3.js 5 Mapping. Build cutting-edge maps and visualizations with JavaScript - Second Edition
This book will show you how build and design maps with D3.js and gives you great insight into projections, colors, and the most appropriate types of map.
The book begins by helping you set up all the tools necessary to build visualizations and maps. Then it covers obtaining geographic data, modifying it to your specific needs, visualizing it with augmented data using D3.js. It will further show you how to draw and map with the Canvas API and how to publish your visualization. By the end of this book, you'll be creating maps like the election maps and the kind of infographics you'll find on sites like the New York Times.
Wybrane bestsellery
Packt Publishing - inne książki
Dzięki opcji "Druk na żądanie" do sprzedaży wracają tytuły Grupy Helion, które cieszyły sie dużym zainteresowaniem, a których nakład został wyprzedany.
Dla naszych Czytelników wydrukowaliśmy dodatkową pulę egzemplarzy w technice druku cyfrowego.
Co powinieneś wiedzieć o usłudze "Druk na żądanie":
- usługa obejmuje tylko widoczną poniżej listę tytułów, którą na bieżąco aktualizujemy;
- cena książki może być wyższa od początkowej ceny detalicznej, co jest spowodowane kosztami druku cyfrowego (wyższymi niż koszty tradycyjnego druku offsetowego). Obowiązująca cena jest zawsze podawana na stronie WWW książki;
- zawartość książki wraz z dodatkami (płyta CD, DVD) odpowiada jej pierwotnemu wydaniu i jest w pełni komplementarna;
- usługa nie obejmuje książek w kolorze.
Masz pytanie o konkretny tytuł? Napisz do nas: sklep@helion.pl
Książka drukowana



















Oceny i opinie klientów: Learning D3.js 5 Mapping. Build cutting-edge maps and visualizations with JavaScript - Second Edition Thomas Newton, Oscar Villarreal, Lars Verspohl
(0)