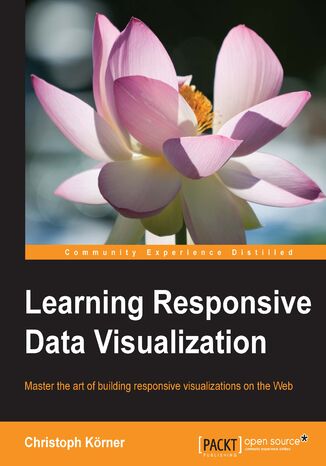
Learning Responsive Data Visualization. Create stunning data visualizations that look awesome on every device and screen resolutions


- Wydawnictwo:
- Packt Publishing
- Ocena:
- Stron:
- 258
- Dostępne formaty:
-
PDFePubMobi
Opis
książki
:
Learning Responsive Data Visualization. Create stunning data visualizations that look awesome on every device and screen resolutions
This book teaches the basics of scalable vector graphics (SVG), D3.js, and Bootstrap while focusing on Responsive Design as well as mobile-first visualizations; the reader will start by discovering Bootstrap and how it can be used for creating responsive applications, and then implement a basic bar chart in D3.js. You will learn about loading, parsing, and filtering data in JavaScript and then dive into creating a responsive visualization by using Media Queries, responsive interactions for Mobile and Desktop devices, and transitions to bring the visualization to life. In the following chapters, we build a fully responsive interactive map to display geographic data using GeoJSON and set up integration testing with Protractor to test the application across real devices using a mobile API gateway such as AWS Device Farm.
You will finish the journey by discovering the caveats of mobile-first applications and learn how to master cross-browser complications.
Wybrane bestsellery
Packt Publishing - inne książki
Dzięki opcji "Druk na żądanie" do sprzedaży wracają tytuły Grupy Helion, które cieszyły sie dużym zainteresowaniem, a których nakład został wyprzedany.
Dla naszych Czytelników wydrukowaliśmy dodatkową pulę egzemplarzy w technice druku cyfrowego.
Co powinieneś wiedzieć o usłudze "Druk na żądanie":
- usługa obejmuje tylko widoczną poniżej listę tytułów, którą na bieżąco aktualizujemy;
- cena książki może być wyższa od początkowej ceny detalicznej, co jest spowodowane kosztami druku cyfrowego (wyższymi niż koszty tradycyjnego druku offsetowego). Obowiązująca cena jest zawsze podawana na stronie WWW książki;
- zawartość książki wraz z dodatkami (płyta CD, DVD) odpowiada jej pierwotnemu wydaniu i jest w pełni komplementarna;
- usługa nie obejmuje książek w kolorze.
Masz pytanie o konkretny tytuł? Napisz do nas:
Książka drukowana


Oceny i opinie klientów: Learning Responsive Data Visualization. Create stunning data visualizations that look awesome on every device and screen resolutions Christoph Körner (0) Weryfikacja opinii następuję na podstawie historii zamówień na koncie Użytkownika umieszczającego opinię. Użytkownik mógł otrzymać punkty za opublikowanie opinii uprawniające do uzyskania rabatu w ramach Programu Punktowego.