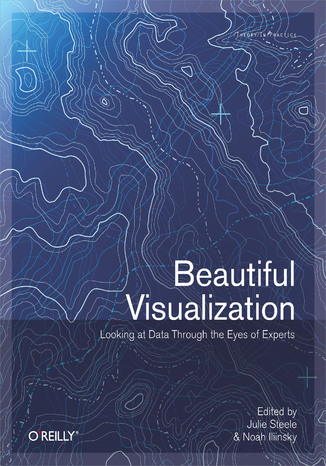
Beautiful Visualization. Looking at Data through the Eyes of Experts

- Autorzy:
- Julie Steele, Noah Iliinsky
- Promocja Przejdź


- Ocena:
- Bądź pierwszym, który oceni tę książkę
- Stron:
- 418
- Dostępne formaty:
-
ePubMobi
Opis książki: Beautiful Visualization. Looking at Data through the Eyes of Experts
Visualization is the graphic presentation of data -- portrayals meant to reveal complex information at a glance. Think of the familiar map of the New York City subway system, or a diagram of the human brain. Successful visualizations are beautiful not only for their aesthetic design, but also for elegant layers of detail that efficiently generate insight and new understanding.
This book examines the methods of two dozen visualization experts who approach their projects from a variety of perspectives -- as artists, designers, commentators, scientists, analysts, statisticians, and more. Together they demonstrate how visualization can help us make sense of the world.
- Explore the importance of storytelling with a simple visualization exercise
- Learn how color conveys information that our brains recognize before we're fully aware of it
- Discover how the books we buy and the people we associate with reveal clues to our deeper selves
- Recognize a method to the madness of air travel with a visualization of civilian air traffic
- Find out how researchers investigate unknown phenomena, from initial sketches to published papers
Contributors include:
Nick Bilton,Michael E. Driscoll,Jonathan Feinberg,Danyel Fisher,Jessica Hagy,Gregor Hochmuth,Todd Holloway,Noah Iliinsky,Eddie Jabbour,Valdean Klump,Aaron Koblin,Robert Kosara,Valdis Krebs,JoAnn Kuchera-Morin et al.,Andrew Odewahn,Adam Perer,Anders Persson,Maximilian Schich,Matthias Shapiro,Julie Steele,Moritz Stefaner,Jer Thorp,Fernanda Viegas,Martin Wattenberg,and Michael Young.
Wybrane bestsellery
-
In the early days of the 20th century, department store magnate JohnWanamaker famously said, "I know that half of my advertising doesn'twork. The problem is that I don't know which half." That remainedbasically true until Google transformed advertising with AdSense basedon new uses of data and an...
-
Data visualization is an efficient and effective medium for communicating large amounts of information, but the design process can often seem like an unexplainable creative endeavor. This concise book aims to demystify the design process by showing you how to use a linear decision-making process ...
Designing Data Visualizations. Representing Informational Relationships Designing Data Visualizations. Representing Informational Relationships
(0,00 zł najniższa cena z 30 dni)50.92 zł
59.90 zł(-15%) -
Dzięki tej książce nauczysz się przekształcać suche dane liczbowe w pełną empatii narrację! Aby spełniły one swoje zadanie, ktoś musi przedstawić zawarte w nich informacje w postaci opowieści. W tej publikacji wyczerpująco i praktycznie opisano przebieg tego procesu. Jej lektura sprawi, że rozwin...
Opowieści ukryte w danych. Wyjaśnij dane i wywołaj działania za pomocą narracji Opowieści ukryte w danych. Wyjaśnij dane i wywołaj działania za pomocą narracji
(0,00 zł najniższa cena z 30 dni)20.90 zł
67.00 zł(-69%) -
Metody statystyczne są kluczowym elementem data science, mimo to niewielu specjalistów data science posiada formalne wykształcenie statystyczne. Kursy i podręczniki o podstawach statystyki, rzadko kiedy omawiają temat z perspektywy data science. W drugim wydaniu tego popularnego podręcznika zosta...
Statystyka praktyczna w data science. 50 kluczowych zagadnień w językach R i Python. Wydanie II Statystyka praktyczna w data science. 50 kluczowych zagadnień w językach R i Python. Wydanie II
(0,00 zł najniższa cena z 30 dni)48.30 zł
69.00 zł(-30%) -
BPMN pozwala na ciągłe analizowanie, monitorowanie i optymalizowanie procesów biznesowych. Jest narzędziem bardzo skutecznym, prawdziwym „świętym Graalem” współczesnego biznesu. Jednak nie jest on niestety tak przyjazny, jak mógłby oczekiwać początkujący użytkownik. Jego oryginalną sp...
Zrozumieć BPMN. Modelowanie procesów biznesowych. Wydanie 2 rozszerzone Zrozumieć BPMN. Modelowanie procesów biznesowych. Wydanie 2 rozszerzone
(0,00 zł najniższa cena z 30 dni)34.30 zł
49.00 zł(-30%) -
Ta książka jest przewodnikiem dla każdego, kto musi przekazywać informacje, robiąc przy tym użytek z danych. Szczególnie wartościowa będzie dla analityków, studentów i naukowców, a także dla każdego, kto w swojej komunikacji odwołuje się do danych. Pokazano tu prostą i intuicyjną technikę przedst...
Storytelling danych. Poradnik wizualizacji danych dla profesjonalistów Storytelling danych. Poradnik wizualizacji danych dla profesjonalistów
(0,00 zł najniższa cena z 30 dni)53.90 zł
77.00 zł(-30%) -
To drugie, w pełni zaktualizowane wydanie znakomitego przewodnika, dzięki któremu bezproblemowo rozpoczniesz pracę z Power BI i w pełni wykorzystasz jego możliwości. Dowiesz się, jak pozyskiwać i oczyszczać dane z różnych źródeł, a także jak zaprojektować model danych, aby móc analizować relacje ...
Microsoft Power BI. Jak modelować i wizualizować dane oraz budować narracje cyfrowe. Wydanie II Microsoft Power BI. Jak modelować i wizualizować dane oraz budować narracje cyfrowe. Wydanie II
Devin Knight, Mitchell Pearson, Bradley Schacht, Erin Ostrowsky
(0,00 zł najniższa cena z 30 dni)53.90 zł
77.00 zł(-30%) -
Termin business intelligence ostatnimi czasy jest odmieniany przez wszystkie przypadki. Według raportu Gartnera z 2020 roku aktualnie liderem w dziedzinie narzędzi BI jest Microsoft - ten kurs video oferuje możliwość zapoznania się z jednym z nich. Power BI, bo o nim mowa, pozwala efektywnie anal...
Power BI Desktop. Kurs video. Wykorzystanie narzędzia w analizie i wizualizacji danych Power BI Desktop. Kurs video. Wykorzystanie narzędzia w analizie i wizualizacji danych
(0,00 zł najniższa cena z 30 dni)194.35 zł
299.00 zł(-35%) -
Data is at the center of many challenges in system design today. Difficult issues need to be figured out, such as scalability, consistency, reliability, efficiency, and maintainability. In addition, we have an overwhelming variety of tools, including relational databases, NoSQL datastores, stream...
Designing Data-Intensive Applications. The Big Ideas Behind Reliable, Scalable, and Maintainable Systems Designing Data-Intensive Applications. The Big Ideas Behind Reliable, Scalable, and Maintainable Systems
(0,00 zł najniższa cena z 30 dni)203.15 zł
239.00 zł(-15%) -
W tym przewodniku opisano zagadnienia związane z podstawami nauki o danych. Wyjaśniono niezbędne elementy matematyki i statystyki. Przedstawiono także techniki budowy potrzebnych narzędzi i sposoby działania najistotniejszych algorytmów. Książka została skonstruowana tak, aby poszczególne impleme...
Data science od podstaw. Analiza danych w Pythonie. Wydanie II Data science od podstaw. Analiza danych w Pythonie. Wydanie II
(0,00 zł najniższa cena z 30 dni)55.30 zł
79.00 zł(-30%)
Ebooka przeczytasz na:
-
czytnikach Inkbook, Kindle, Pocketbook i innych
-
systemach Windows, MacOS i innych
-
systemach Windows, Android, iOS, HarmonyOS
-
na dowolnych urządzeniach i aplikacjach obsługujących formaty: PDF, EPub, Mobi
Masz pytania? Zajrzyj do zakładki Pomoc »
Audiobooka posłuchasz:
-
w aplikacji Ebookpoint na Android, iOS, HarmonyOs
-
na systemach Windows, MacOS i innych
-
na dowolonych urządzeniach i aplikacjach obsługujących format MP3 (pliki spakowane w ZIP)
Masz pytania? Zajrzyj do zakładki Pomoc »
Kurs Video zobaczysz:
-
w aplikacji Ebookpoint na Android, iOS, HarmonyOs
-
na systemach Windows, MacOS i innych
-
na dowolonych urządzeniach i aplikacjach obsługujących format MP4 (pliki spakowane w ZIP)
Szczegóły książki
- ISBN Ebooka:
- 978-14-493-9068-6, 9781449390686
- Data wydania ebooka:
-
2010-04-23
Data wydania ebooka często jest dniem wprowadzenia tytułu do sprzedaży i może nie być równoznaczna z datą wydania książki papierowej. Dodatkowe informacje możesz znaleźć w darmowym fragmencie. Jeśli masz wątpliwości skontaktuj się z nami sklep@helion.pl.
- Język publikacji:
- angielski
- Rozmiar pliku ePub:
- 26.6MB
- Rozmiar pliku Mobi:
- 58.8MB
- Kategorie:
Big Data » Analiza danych
Spis treści książki
- Beautiful Visualization
- SPECIAL OFFER: Upgrade this ebook with OReilly
- Preface
- How This Book Is Organized
- Conventions Used in This Book
- Using Code Examples
- How to Contact Us
- Safari Books Online
- Acknowledgments
- 1. On Beauty
- What Is Beauty?
- Novel
- Informative
- Efficient
- Aesthetic
- What Is Beauty?
- Learning from the Classics
- The Periodic Table of the Elements
- The London Underground Map
- Other Subway Maps and Periodic Tables Are Weak Imitations
- How Do We Achieve Beauty?
- Step Outside Default Formats
- Make It Informative
- Intended message
- Context of use.
- Intended message
- Make It Efficient
- Visually emphasize what matters
- Use axes to convey meaning and give free information
- Slice along relevant divisions
- Use conventions thoughtfully
- Leverage the Aesthetics
- Putting It Into Practice
- Conclusion
- 2. Once Upon a Stacked Time Series
- Question + Visual Data + Context = Story
- Steps for Creating an Effective Visualization
- Formulate the Question
- Gather the Data
- Apply a Visual Representation
- Size
- Color
- Location
- Networks
- Time
- Using multiple visual presentation methods
- Hands-on Visualization Creation
- Data Tasks
- Gathering the data
- Sorting the data: The discovery version
- Sorting the data: The technical version
- Data Tasks
- Formulating the Question
- Grouping the data
- Applying the Visual Presentation
- A note about area and circles
- Presenting the data with country maps
- Building the Visual
- Conclusion
- 3. Wordle
- Wordles Origins
- Anatomy of a Tag Cloud
- Filling a Two-Dimensional Space
- Wordles Origins
- How Wordle Works
- Text Analysis
- Finding words
- Determining the script
- Guessing the language and removing stop words
- Assigning weights to words
- Text Analysis
- Layout
- Weighted words into shapes
- The playing field
- Placement
- Intersection testing
- Is Wordle Good Information Visualization?
- Word Sizing Is Nave
- Color Is Meaningless
- Fonts Are Fanciful
- Word Count Is Not Specific Enough
- How Wordle Is Actually Used
- Using Wordle for Traditional Infovis
- Conclusion
- Acknowledgments
- References
- 4. Color: The Cinderella of Data Visualization
- Why Use Color in Data Graphics?
- 1. Vary Your Plotting Symbols
- 2. Use Small Multiples on a Canvas
- 3. Add Color to Your Data
- So Why Bother with Color?
- If Color Is Three-Dimensional, Can I Encode Three Dimensions with It?
- Why Use Color in Data Graphics?
- Luminosity As a Means of Recovering Local Density
- Looking Forward: What About Animation?
- Methods
- Conclusion
- References and Further Reading
- 5. Mapping Information: Redesigning the New York City Subway Map
- The Need for a Better Tool
- London Calling
- New York Blues
- Better Tools Allow for Better Tools
- Size Is Only One Factor
- Looking Back to Look Forward
- New York's Unique Complexity
- Geography Is About Relationships
- Include the Essentials
- Leave Out the Clutter
- Coloring Inside the Lines
- Sweat the Small Stuff
- Try It On
- Users Are Only Human
- A City of Neighborhoods
- One Size Does Not Fit All
- Conclusion
- 6. Flight Patterns: A Deep Dive
- Techniques and Data
- Color
- Motion
- Anomalies and Errors
- Conclusion
- Acknowledgments
- 7. Your Choices Reveal Who You Are: Mining and Visualizing Social Patterns
- Early Social Graphs
- Social Graphs of Amazon Book Purchasing Data
- Determining the Network Around a Particular Book
- Putting the Results to Work
- Social Networks of Political Books
- Conclusion
- References
- 8. Visualizing the U.S. Senate Social Graph (19912009)
- Building the Visualization
- Gathering the Raw Data
- Computing the Voting Affinity Matrix
- Visualizing the Data with GraphViz
- Building the Visualization
- The Story That Emerged
- What Makes It Beautiful?
- And What Makes It Ugly?
- Labels
- Orientation
- Party Affiliation
- Conclusion
- References
- 9. The Big Picture: Search and Discovery
- The Visualization Technique
- YELLOWPAGES.COM
- Query Logs
- Categorical Similarity
- Visualization As a Substrate for Analytics
- The Visualization
- Advantages and Disadvantages of the Technique
- The Netflix Prize
- Preference Similarity
- Labeling
- Closer Looks
- Creating Your Own
- Conclusion
- References
- 10. Finding Beautiful Insights in the Chaos of Social Network Visualizations
- Visualizing Social Networks
- Who Wants to Visualize Social Networks?
- The Design of SocialAction
- Case Studies: From Chaos to Beauty
- The Social Network of Senatorial Voting
- The Social Network of Terrorists
- References
- 11. Beautiful History: Visualizing Wikipedia
- Depicting Group Editing
- The Data
- History Flow: Visualizing Edit Histories
- Age of Edit
- Authorship
- Individual Authors
- Depicting Group Editing
- History Flow in Action
- Communicating the Results
- Chromogram: Visualizing One Person at a Time
- Showing All the Data
- What We Saw
- Analyzing the Data
- Conclusion
- 12. Turning a Table into a Tree: Growing Parallel Sets into a Purposeful Project
- Categorical Data
- Parallel Sets
- Visual Redesign
- A New Data Model
- The Database Model
- Growing the Tree
- Parallel Sets in the Real World
- Conclusion
- References
- 13. The Design of "X by Y"
- Briefing and Conceptual Directions
- Understanding the Data Situation
- Exploring the Data
- First Visual Drafts
- The Visual Principle
- The Final Product
- All Submissions
- By Prize
- By Category
- By Country
- By Year
- By Year and Category
- Exhibition
- Conclusion
- Acknowledgments
- References
- 14. Revealing Matrices
- The More, the Better?
- Databases As Networks
- Data Model Definition Plus Emergence
- Network Dimensionality
- The Matrix Macroscope
- Reducing for Complexity
- Further Matrix Operations
- The Refined Matrix
- Scaling Up
- Further Applications
- Conclusion
- Acknowledgments
- References
- 15. This Was 1994: Data Exploration with the NYTimes Article Search API
- Getting Data: The Article Search API
- Managing Data: Using Processing
- Three Easy Steps
- Faceted Searching
- Making Connections
- Conclusion
- 16. A Day in the Life of the New York Times
- Collecting Some Data
- Let's Clean 'Em First
- Python, Map/Reduce, and Hadoop
- The First Pass at the Visualization
- Processing
- The Underlay Map
- Now, Where's That Data We Just Processed?
- Scene 1, Take 1
- No Scale
- No Sense of Time
- Time-Lapse
- Scene 1, Take 2
- Let's Run This Thing and See What Happens!
- The Second Pass at the Visualization
- Back to That Scale Problem
- Massaging the Data Some More
- The New Data Format
- Visual Scale and Other Visualization Optimizations
- Getting the Time Lapse Working
- Semiautomating
- Math for Rendering Time-Lapse Video
- So, What Do We Do with This Thing?
- Conclusion
- Acknowledgments
- 17. Immersed in Unfolding Complex Systems
- Our Multimodal Arena
- Our Roadmap to Creative Thinking
- Beauty and Symmetry
- The Computational Medium
- Interpretation As a Filter
- Project Discussion
- Allobrain
- Artificial Nature
- Hydrogen Bond
- Hydrogen Atom
- Hydrogen Atom with Spin
- Coherent Precession of Electron Spin
- Conclusion
- References
- 18. Postmortem Visualization: The Real Gold Standard
- Background
- Impact on Forensic Work
- The Virtual Autopsy Procedure
- Data Acquisition
- Computed tomography: Use of dual energy CT
- MRI: Use of synthetic magnetic resonance imaging
- Data Acquisition
- Visualization: Image Analysis
- Objective Documentation
- Advantages and Disadvantages of Virtual Autopsy
- The Future for Virtual Autopsies
- Conclusion
- References and Suggested Reading
- 19. Animation for Visualization: Opportunities and Drawbacks
- Principles of Animation
- Animation in Scientific Visualization
- Learning from Cartooning
- The Downsides of Animation
- GapMinder and Animated Scatterplots
- Too many dots?
- Testing Animated Scatterplots
- Exploration with animation is slower
- Animation is less accurate
- Presentation Is Not Exploration
- Types of Animation
- Dynamic Data, Animated Recentering
- A Taxonomy of Animations
- Staging Animations with DynaVis
- Principles of Animation
- Conclusion: Animate or Not?
- Further Reading
- Acknowledgments
- References
- 20. Visualization: Indexed.
- Visualization: It's an Elephant.
- Visualization: It's Art.
- Visualization: It's Business.
- Visualization: It's Timeless.
- Visualization: It's Right Now.
- Visualization: It's Coded.
- Visualization: It's Clear.
- Visualization: It's Learnable.
- Visualization: It's a Buzzword.
- Visualization: It's an Opportunity.
- A. Contributors
- B. Colophon
- Index
- About the Authors
- SPECIAL OFFER: Upgrade this ebook with OReilly
- Copyright
O'Reilly Media - inne książki
-
FinOps brings financial accountability to the variable spend model of cloud. Used by the majority of global enterprises, this management practice has grown from a fringe activity to the de facto discipline managing cloud spend. In this book, authors J.R. Storment and Mike Fuller outline the proce...(0,00 zł najniższa cena z 30 dni)
262.65 zł
309.00 zł(-15%) -
Edge AI is transforming the way computers interact with the real world, allowing IoT devices to make decisions using the 99% of sensor data that was previously discarded due to cost, bandwidth, or power limitations. With techniques like embedded machine learning, developers can capture human intu...(0,00 zł najniższa cena z 30 dni)
262.65 zł
309.00 zł(-15%) -
Why is it difficult for so many companies to get digital identity right? If you're still wrestling with even simple identity problems like modern website authentication, this practical book has the answers you need. Author Phil Windley provides conceptual frameworks to help you make sense of all ...(0,00 zł najniższa cena z 30 dni)
186.15 zł
219.00 zł(-15%) -
Python was recently ranked as today's most popular programming language on the TIOBE index, thanks to its broad applicability to design and prototyping to testing, deployment, and maintenance. With this updated fourth edition, you'll learn how to get the most out of Python, whether you're a profe...(0,00 zł najniższa cena z 30 dni)
296.65 zł
349.00 zł(-15%) -
With the accelerating speed of business and the increasing dependence on technology, companies today are significantly changing the way they build in-house business solutions. Many now use low-code and no code technologies to help them deal with specific issues, but that's just the beginning. Wit...
Building Solutions with the Microsoft Power Platform Building Solutions with the Microsoft Power Platform
(0,00 zł najniższa cena z 30 dni)262.65 zł
309.00 zł(-15%) -
Companies are scrambling to integrate AI into their systems and operations. But to build truly successful solutions, you need a firm grasp of the underlying mathematics. This accessible guide walks you through the math necessary to thrive in the AI field such as focusing on real-world application...(0,00 zł najniższa cena z 30 dni)
262.65 zł
309.00 zł(-15%) -
DevOps engineers, developers, and security engineers have ever-changing roles to play in today's cloud native world. In order to build secure and resilient applications, you have to be equipped with security knowledge. Enter security as code.In this book, authors BK Sarthak Das and Virginia Chu d...(0,00 zł najniższa cena z 30 dni)
186.15 zł
219.00 zł(-15%) -
With the increasing use of AI in high-stakes domains such as medicine, law, and defense, organizations spend a lot of time and money to make ML models trustworthy. Many books on the subject offer deep dives into theories and concepts. This guide provides a practical starting point to help develop...(0,00 zł najniższa cena z 30 dni)
262.65 zł
309.00 zł(-15%) -
Why are so many companies adopting GitOps for their DevOps and cloud native strategy? This reliable framework is quickly becoming the standard method for deploying apps to Kubernetes. With this practical, developer-oriented book, DevOps engineers, developers, IT architects, and SREs will learn th...(0,00 zł najniższa cena z 30 dni)
262.65 zł
309.00 zł(-15%) -
Learn the essentials of working with Flutter and Dart to build full stack applications that meet the needs of a cloud-driven world. Together, the Flutter open source UI software development kit and the Dart programming language for client development provide a unified solution to building applica...(0,00 zł najniższa cena z 30 dni)
220.15 zł
259.00 zł(-15%)
Dzieki opcji "Druk na żądanie" do sprzedaży wracają tytuły Grupy Helion, które cieszyły sie dużym zainteresowaniem, a których nakład został wyprzedany.
Dla naszych Czytelników wydrukowaliśmy dodatkową pulę egzemplarzy w technice druku cyfrowego.
Co powinieneś wiedzieć o usłudze "Druk na żądanie":
- usługa obejmuje tylko widoczną poniżej listę tytułów, którą na bieżąco aktualizujemy;
- cena książki może być wyższa od początkowej ceny detalicznej, co jest spowodowane kosztami druku cyfrowego (wyższymi niż koszty tradycyjnego druku offsetowego). Obowiązująca cena jest zawsze podawana na stronie WWW książki;
- zawartość książki wraz z dodatkami (płyta CD, DVD) odpowiada jej pierwotnemu wydaniu i jest w pełni komplementarna;
- usługa nie obejmuje książek w kolorze.
W przypadku usługi "Druk na żądanie" termin dostarczenia przesyłki może obejmować także czas potrzebny na dodruk (do 10 dni roboczych)
Masz pytanie o konkretny tytuł? Napisz do nas: sklep[at]helion.pl.
Książka, którą chcesz zamówić pochodzi z końcówki nakładu. Oznacza to, że mogą się pojawić drobne defekty (otarcia, rysy, zagięcia).
Co powinieneś wiedzieć o usłudze "Końcówka nakładu":
- usługa obejmuje tylko książki oznaczone tagiem "Końcówka nakładu";
- wady o których mowa powyżej nie podlegają reklamacji;
Masz pytanie o konkretny tytuł? Napisz do nas: sklep[at]helion.pl.


Oceny i opinie klientów: Beautiful Visualization. Looking at Data through the Eyes of Experts Julie Steele, Noah Iliinsky (0)
Weryfikacja opinii następuję na podstawie historii zamówień na koncie Użytkownika umieszczającego opinię. Użytkownik mógł otrzymać punkty za opublikowanie opinii uprawniające do uzyskania rabatu w ramach Programu Punktowego.