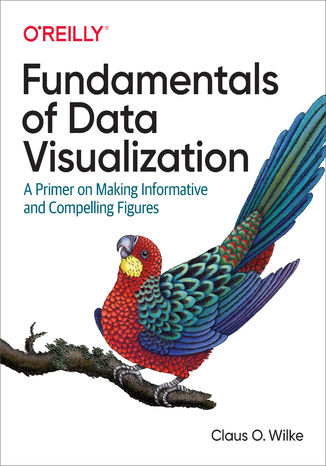
Fundamentals of Data Visualization. A Primer on Making Informative and Compelling Figures Claus O. Wilke


- Autor:
- Claus O. Wilke
- Wydawnictwo:
- O'Reilly Media
- Ocena:
- Stron:
- 390
- Dostępne formaty:
-
ePubMobi
Opis
książki
:
Fundamentals of Data Visualization. A Primer on Making Informative and Compelling Figures
Effective visualization is the best way to communicate information from the increasingly large and complex datasets in the natural and social sciences. But with the increasing power of visualization software today, scientists, engineers, and business analysts often have to navigate a bewildering array of visualization choices and options.
This practical book takes you through many commonly encountered visualization problems, and it provides guidelines on how to turn large datasets into clear and compelling figures. What visualization type is best for the story you want to tell? How do you make informative figures that are visually pleasing? Author Claus O. Wilke teaches you the elements most critical to successful data visualization.
- Explore the basic concepts of color as a tool to highlight, distinguish, or represent a value
- Understand the importance of redundant coding to ensure you provide key information in multiple ways
- Use the book’s visualizations directory, a graphical guide to commonly used types of data visualizations
- Get extensive examples of good and bad figures
- Learn how to use figures in a document or report and how employ them effectively to tell a compelling story
Wybrane bestsellery
O'Reilly Media - inne książki
Dzięki opcji "Druk na żądanie" do sprzedaży wracają tytuły Grupy Helion, które cieszyły sie dużym zainteresowaniem, a których nakład został wyprzedany.
Dla naszych Czytelników wydrukowaliśmy dodatkową pulę egzemplarzy w technice druku cyfrowego.
Co powinieneś wiedzieć o usłudze "Druk na żądanie":
- usługa obejmuje tylko widoczną poniżej listę tytułów, którą na bieżąco aktualizujemy;
- cena książki może być wyższa od początkowej ceny detalicznej, co jest spowodowane kosztami druku cyfrowego (wyższymi niż koszty tradycyjnego druku offsetowego). Obowiązująca cena jest zawsze podawana na stronie WWW książki;
- zawartość książki wraz z dodatkami (płyta CD, DVD) odpowiada jej pierwotnemu wydaniu i jest w pełni komplementarna;
- usługa nie obejmuje książek w kolorze.
Masz pytanie o konkretny tytuł? Napisz do nas: sklep@helion.pl
Książka drukowana





















Oceny i opinie klientów: Fundamentals of Data Visualization. A Primer on Making Informative and Compelling Figures Claus O. Wilke
(0)