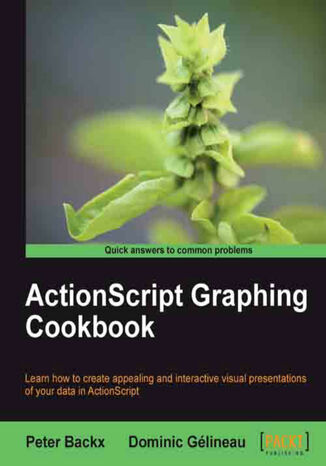
ActionScript Graphing Cookbook. Learn how to create appealing and interactive visual presentations of your data in ActionScript with this book and


- Wydawnictwo:
- Packt Publishing
- Ocena:
- Stron:
- 288
- Dostępne formaty:
-
PDFePubMobi
Opis
książki
:
ActionScript Graphing Cookbook. Learn how to create appealing and interactive visual presentations of your data in ActionScript with this book and
Wybrane bestsellery
Packt Publishing - inne książki
Dzięki opcji "Druk na żądanie" do sprzedaży wracają tytuły Grupy Helion, które cieszyły sie dużym zainteresowaniem, a których nakład został wyprzedany.
Dla naszych Czytelników wydrukowaliśmy dodatkową pulę egzemplarzy w technice druku cyfrowego.
Co powinieneś wiedzieć o usłudze "Druk na żądanie":
- usługa obejmuje tylko widoczną poniżej listę tytułów, którą na bieżąco aktualizujemy;
- cena książki może być wyższa od początkowej ceny detalicznej, co jest spowodowane kosztami druku cyfrowego (wyższymi niż koszty tradycyjnego druku offsetowego). Obowiązująca cena jest zawsze podawana na stronie WWW książki;
- zawartość książki wraz z dodatkami (płyta CD, DVD) odpowiada jej pierwotnemu wydaniu i jest w pełni komplementarna;
- usługa nie obejmuje książek w kolorze.
Masz pytanie o konkretny tytuł? Napisz do nas: sklep@helion.pl
Książka drukowana














Oceny i opinie klientów: ActionScript Graphing Cookbook. Learn how to create appealing and interactive visual presentations of your data in ActionScript with this book and Peter Backx, Dominic Gelineau (0) Weryfikacja opinii następuję na podstawie historii zamówień na koncie Użytkownika umieszczającego opinię. Użytkownik mógł otrzymać punkty za opublikowanie opinii uprawniające do uzyskania rabatu w ramach Programu Punktowego.